by Trent Smalley, CMT | Jan 2, 2022 | stocks to buy, Technical Stock Market Analysis
Hello all, and welcome to 2022! A long time reader of OmahaCharts recently brought to my attention that I rarely blog about individual stocks anymore. In the old days, this site catered more to traders. In the old days I myself was more of a “trader.” My...

by Trent Smalley, CMT | Jul 19, 2017 | Investing, Stock Market Commentary, Stock Market Trends, stocks to buy, Technical Stock Market Analysis
In Q1 of this year, I took a significant chunk of long term money and began buying this little $IPI stock. I don’t make it a habit of investing long term into stocks that are trading around a buck, but there is a method to this madness. Take a look at the charts...

by Trent Smalley, CMT | Jun 20, 2017 | Stock Market Analysis, Stock Market Trends, stocks to buy
There are 3 new letters after my name. Pretty cool huh? No? Well how about the last post when I told you to get into $VSLR? Take my advice? See the chart now? https://omahacharts.com/single-post/2017/06/15/Keeping-An-Eye-On-Vivint-Solar I shall return soon with more...

by Trent Smalley, CMT | Jun 15, 2017 | Stock Market Analysis, Stock Market Trends, stocks to buy, Technical Stock Market Analysis
I am quite sure nothing good will come of this, but I have a close eye on Vivint Solar, $VSLR here. One of my RRGs tipped me off that $TAN (Solar ETF) was making a move towards the leading quadrant and may soon begin to outperform. Take a look at the volume profile of...

by Trent Smalley, CMT | May 25, 2017 | Stock Market Analysis, Stock Market Commentary, Stock Market Trends, stocks to buy, Technical Stock Market Analysis
Shares of the internet music streaming company have gone over about as well as a turd in the punch bowl as of late, but I think they are primed for a pop soon. Taking a look at a weekly chart of $P taking into account 2.5 years of price data, we can see from the Optex...

by Trent Smalley, CMT | May 1, 2017 | Stock Market Commentary, Stock Market Trends, stocks to buy
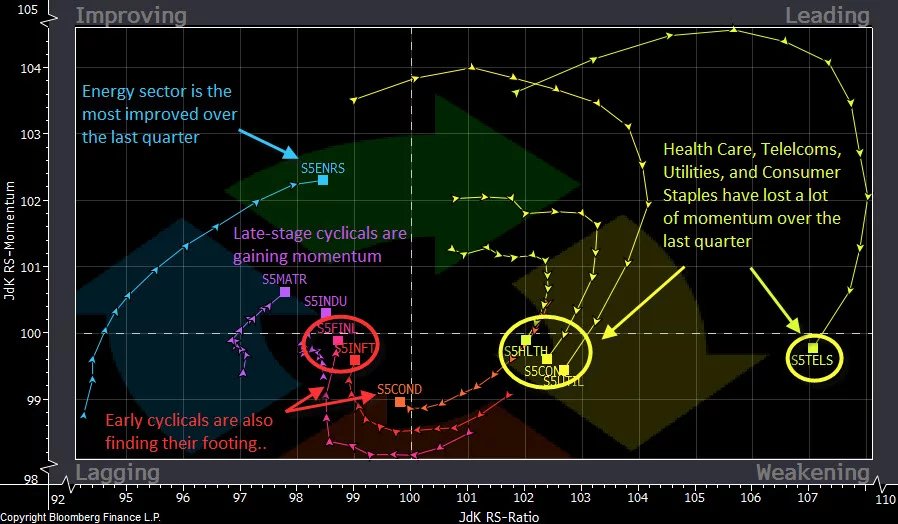
At the start of each week I like to make reference to an RRG Chart to gain a sense of the overall investing landscape. Relative Rotation Graphs are a unique and powerful tool to visually see flow of funds and relative strength of individual securities, commodities,...


