
This week, we are going to put the concepts covered in the last two posts to work in order to come up with a stock price forecast several years into the future. If you haven’t yet, be sure to read both “Stock Selection Process, Simplified” as well as “A Powerful Buffett Concept Revisited: The Equity Bond.” These posts lay the groundwork for what is to follow.
After the last two articles, you are familiar with the kinds of companies that make for quality long term investments. Namely, those which enjoy a durable competitive advantage which leads to both strong earnings growth and earnings stability. Perhaps you put together a list of companies with satisfactory ROIC or ROE, keeping in mind your initial rate of return using earnings yield. But what kind of return on investment can you expect years into the future? It has been shown time and again that analyst “price targets” are next to useless, especially in the near term. And in my experience, when leaning on someone else’s work or taking their word for it, you are much less likely to stick with an investment when the next inevitable short term down turn comes. You can do your own analysis, formulate your own price targets, and take more confidence that you’ve wisely invested your dollars using the system outlined below.
Our example today uses the earnings per share (EPS) for ASML Holding NV which is a core position in JSPM LLC client portfolios I manage. ASML is the leader in photolithography systems used in the manufacturing of semiconductors. These machines are crucial in the production of advanced integrated circuits (ICs), including microprocessors, memory chips, and other semiconductor devices. ASML’s return on invested capital (ROIC) began accelerating in 2020 leading me to believe that their competitive position within the semi conductor space was only getting stronger:
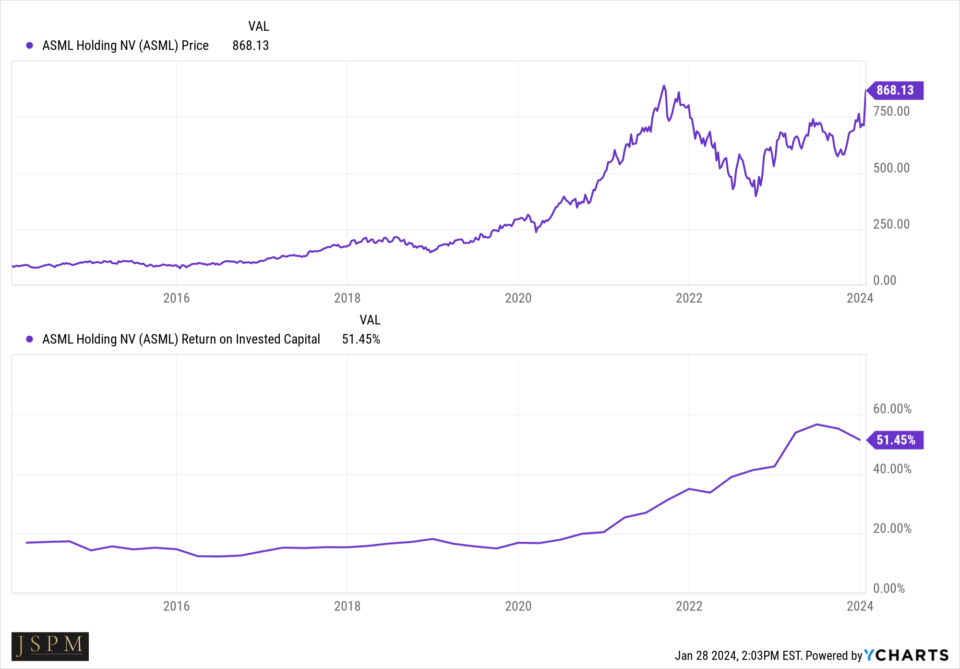
One might expect with such strong ROIC that it would follow that EPS stability and more importantly, EPS growth were in place. Indeed they are:
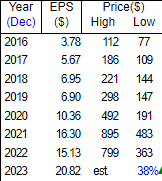
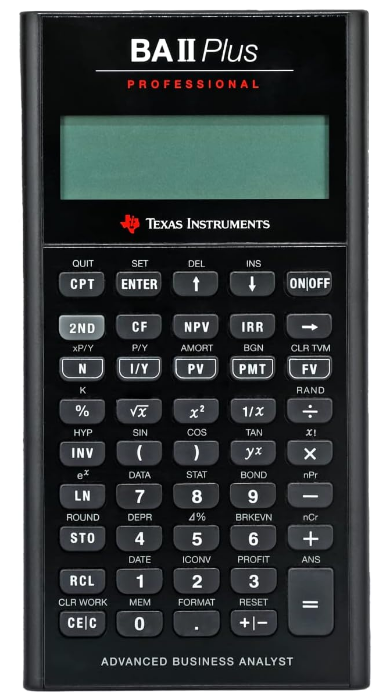
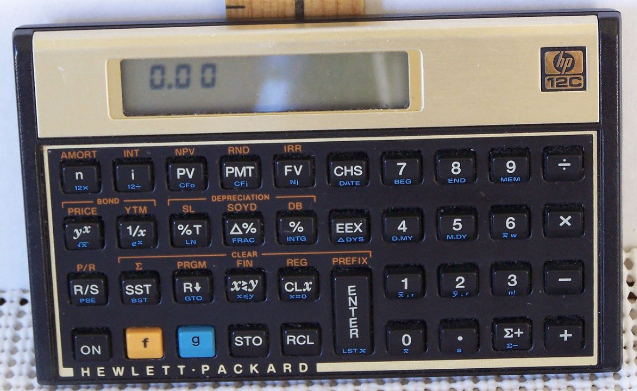
Knowing we have strong ROIC, earnings stability, and earnings growth allows us to use historical EPS growth in order to project this growth into the future, and finally helps us consider stock price estimates as well. Afterall, the stock price is how we are awarded for our investment. The above image shows the EPS figures for ASML for the past 8 years. For this particular method of forecasting, I personally use between 5 and 10 years worth of data, although I would be hesitant to use less than 5. You can also use 5 years as well as 10 years and take an average of the two. In either case, the process is a projection, or an estimation based on the past which should always be kept in mind. Now, for those of you “lucky” enough to have attended finance school, you might have your old financial calculator laying around. Remember these?
And, if you weren’t so lucky, that’s okay. We have websites that will run your time value of money formulas for you like https://cagrcalculator.net/
What we are after here is the compound annual growth rate (CAGR). Inputting our first year of EPS (3.78), our ending value of EPS from the most recent year (20.82) and the number of periods, in this case years, we have our CAGR for ASML from 2016-2023:
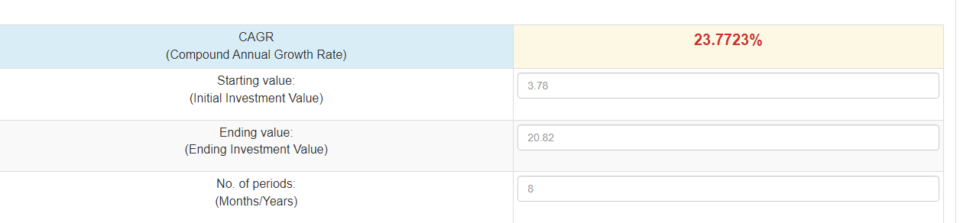
We can see that over the past 8 years, ASML has had a EPS CAGR of 23.7%. This is a very unique situation (and company) in that they are positioned in the right industry group just as the artificial intelligence boom has gotten underway. The majority of more mature companies cannot grow EPS at this rate. But for the sake of simplicity let’s assume they continue to take advantage of the massive investment in AI taking place, and continue to compound earnings at 23.7% for the next 8 years. Calculator time again:
PV = -20.82, N = 8, PMT = 0, I/Y = 23.7, CPT FV = 114
Should ASML compound EPS at 23.7% for the next 8 years as they did in the previous 8, EPS would be $114 in 2032. Finally, about that potential stock price in year 2032?
For this we need some historical data about ASML’s price to earnings (PE) ratio over that same time frame. This is how much investors have been willing to pay for projected earnings in the past:
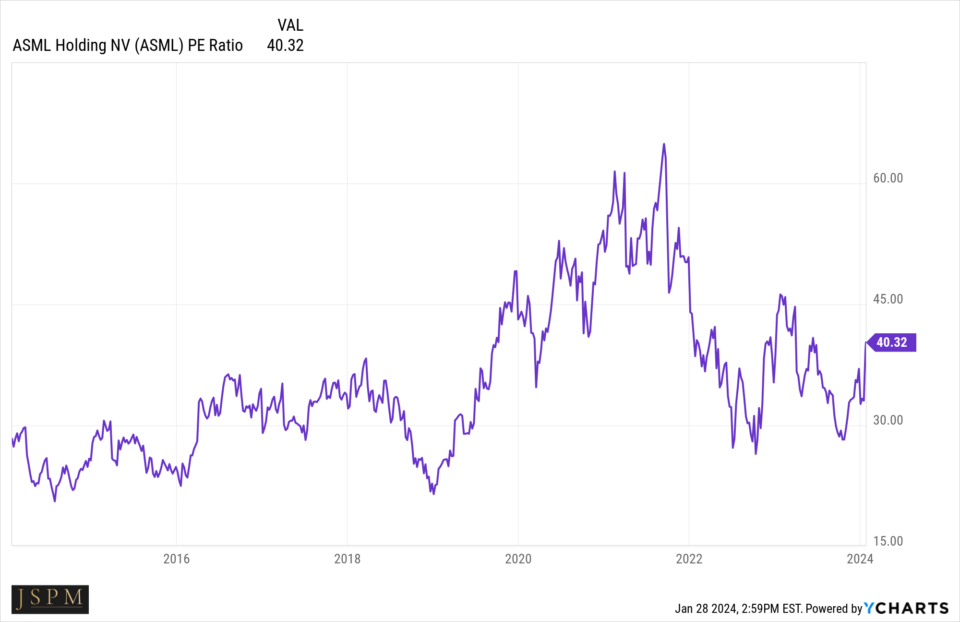
We can see that during times of market euphoria, investors have been willing to pay as much as approximately 60 times for ASML earnings. In times of market downturns, as little as 25 times earnings. A line of best fit or average PE might be seen as 35. So, now that we have a projected EPS of $114 in year 2032 and a historical average PE investors may be willing to pay for that EPS:
$114 x 35 = $3990 projected share price in year 2032.
As I write, the share price for ASML stands at $867. Seem to good to be true? It very well might be. Seem to low? Also a possibility. But that is the nature of prudent individual stock investment. We are taking what a company has been able to achieve in the past and making assumptions about what is possible for them in the future. Perhaps you think a CAGR of over 23% for a company this size isn’t realistic and decide to do your calculations using 15%. Maybe you don’t have an eight year investment timeframe and decide to project using only the past 3-5 years. The world is your oyster, go for it. Now that you have an understanding of how you can run your own stock price projections using historical EPS figures, CAGRs, and average price to earnings ratios, you can be your own analyst. In more cases than not, using this very same method on appropriate companies will help you arrive at a price target for your investment timeframe, and will yield projections closer than a Wall Street analyst. And best of all, you won’t have to take anyone else’s word for it.
Good luck!
Trent J. Smalley, CMT
This post is dedicated in loving memory to Mary Smalley. An avid reader (of mostly anything other than finance, with the exception of this blog).
Please remember that past performance may not be indicative of future results. Different types of
investments involve varying degrees of risk, and there can be no assurance that the future performance
of any specific investment, investment strategy, or product made reference to directly or indirectly in this
newsletter (article), will be profitable, equal any corresponding indicated historical performance level(s),
or be suitable for your portfolio. Due to various factors, including changing market conditions, the content
may no longer be reflective of current opinions or positions. Moreover, you should not assume that any
discussion or information contained in this newsletter (article) serves as the receipt of, or as a substitute
for, personalized investment advice from JSPM LLC. To the extent that a reader has any
questions regarding the applicability of any specific issue discussed above to his/her individual situation,
he/she is encouraged to consult with the professional advisor of his/her choosing. A copy of our current
written disclosure statement discussing our advisory services and fees is available for review upon review.