
Welcome to 2024. Some of you might remember me, others might not. For years I wrote about markets right here at Omahacharts.com. In the early days of this site, I was a very active trader of my own personal funds. Essentially serving as my online trading diary, this blog garnered a following of readers and at times, a large numbers of readers. About four years ago I transitioned into a professional role as a portfolio manager of client funds through our RIA, JSPM LLC. While my day to day duties no longer afford me the time to write a daily post, I have greatly missed writing. The goal going forward is a weekly update covering any and all things market related: individual stock selection, portfolio construction, asset allocation, technical and quantitative analysis, fundamental analysis, macro economic analysis, and other commentary. While a blog may be an outdated medium of discourse when it comes to finance, I feel like it still has its place. At some point I might get around to a YouTube channel or podcast, but for the time being I’ll be sharing my thoughts here. Hopefully this site can help demystify the world of investing to those who are interested. The posts that follow will be done with those readers in mind. Let’s get to it.
This week’s topic covers a distillation of the fundamental process by which I go about building and then selecting individual stocks for longer term holds within a portfolio. While entire textbooks have been written on the subjects of security analysis and financial accounting (I’ve read almost all of them), you don’t have to get lost in analysis paralysis in order to begin fishing in a pond ripe with quality companies in which to invest. To keep things very simple, we need to answer two questions: What and when? We’ll begin with that what.
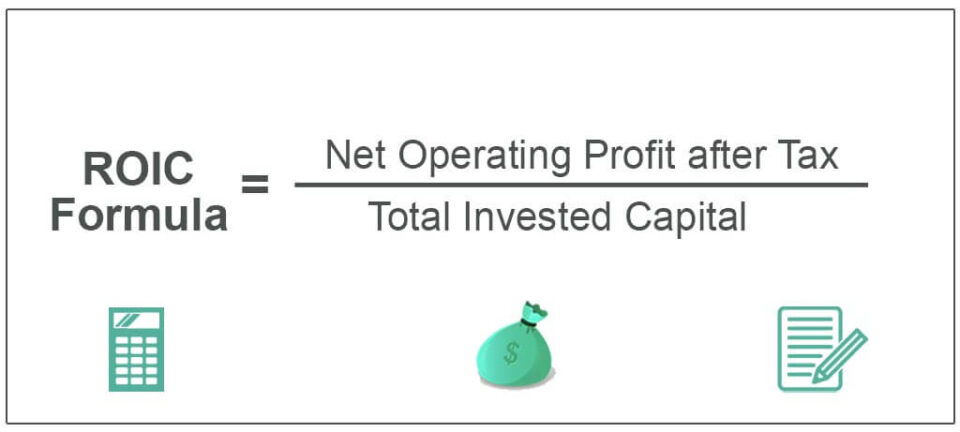
Among the countless fundamental data points and financial ratios to choose from, my preferred measure when selecting the “what” is Return On Invested Capital (ROIC). Return on invested capital or ROIC is a calculation which determines how well a company allocates its capital to profitable projects and investments. You can think of high ROIC companies as those which earn above average profits from what they had to lay out in order to create those earnings. Companies that can expand by investing a portion of their earnings at high rates of return are generally much more attractive than those only capable of investing at low rates of return. A business needs two things to operate, fixed capital (like property, plant and equipment) and working capital (like inventory). The goal is to measure how well a company can turn new investments in working capital and fixed assets into earnings. ROIC is a great barometer of doing just that.
Warren Buffett uses a close relative of ROIC called Return on Equity or ROE as a starting point in the search for a company possessing a durable competitive advantage. Either method works just fine. What is considered a high ROIC? A quick query using Open AI’s ChatGPT returns the following:
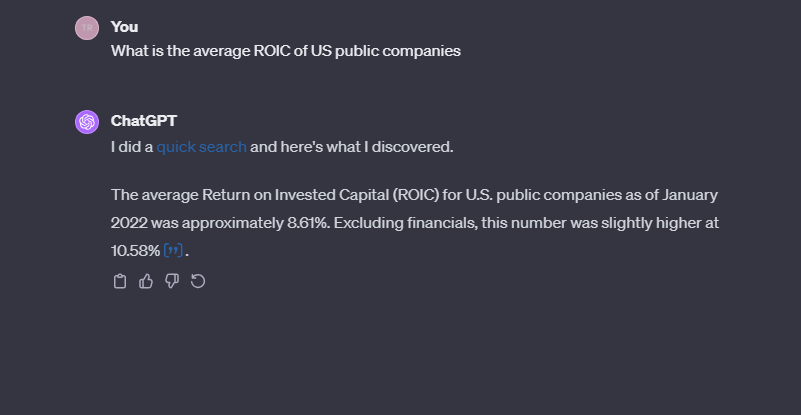
Knowing the average ROIC of U.S. listed public companies as of 2022, we can begin our search with a screen for those demonstrating superior return on invested capital. Any number of online fundamental stock screening tools will have this functionality. Just make sure whichever you choose uses quality fundamental data. I use several and then cross check them to make sure the companies returned are present across each of the lists. Over the years I have found YCharts and Koyfin to both have quality data. A recent screen for ROIC above 25% yielded between 230-250 companies. You may wish to exclude financials, shell companies and newer companies from this list, at least in your initial foray into screens of this type.
Now that you have a “pond from which to fish” we tackle the second but important aspect of this simplied stock selection process, the “when.” There are multiple methods of the when which may be defined by elements such as investor time horizon, available capital, and investment process. Some prefer to dollar cost average into a position over multiple weeks, months, or even quarters. Others will employ any number of technical or quantitative strategies to to work their way into a stock investment. One strategy I find particularly useful is keeping Earnings Yield in mind.
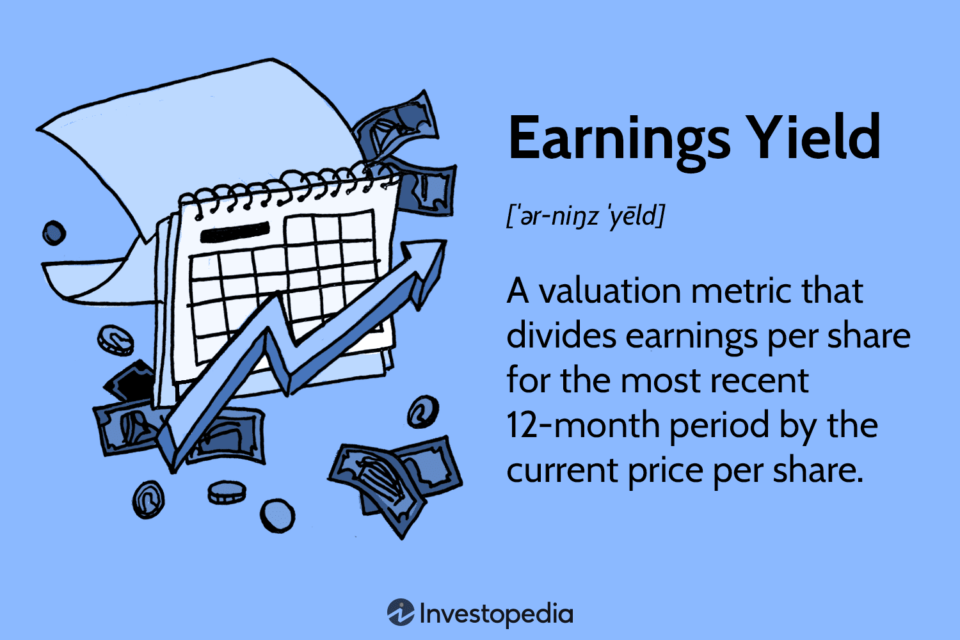
As you might have noticed, the earnings yield is the inverse of the widely used P/E ratio. Quoted as a percentage, the earnings yield allows us to immediately compare percentages across other possible investment choices and most importantly, to risk free rates of interest. We can think of earnings yield as how much we are paying for the share of earnings that we become entitled to upon purchase. We want a higher earnings yield as opposed to a lower one as the higher the earnings yield, the more we are getting for our money. We also want to keep the risk free rate in mind. An example below will help to tie together what we have covered.

Axcelis Technologies (ACLS) within the semiconductor space meets both of our criterion of “what and when” at the time of this writing.
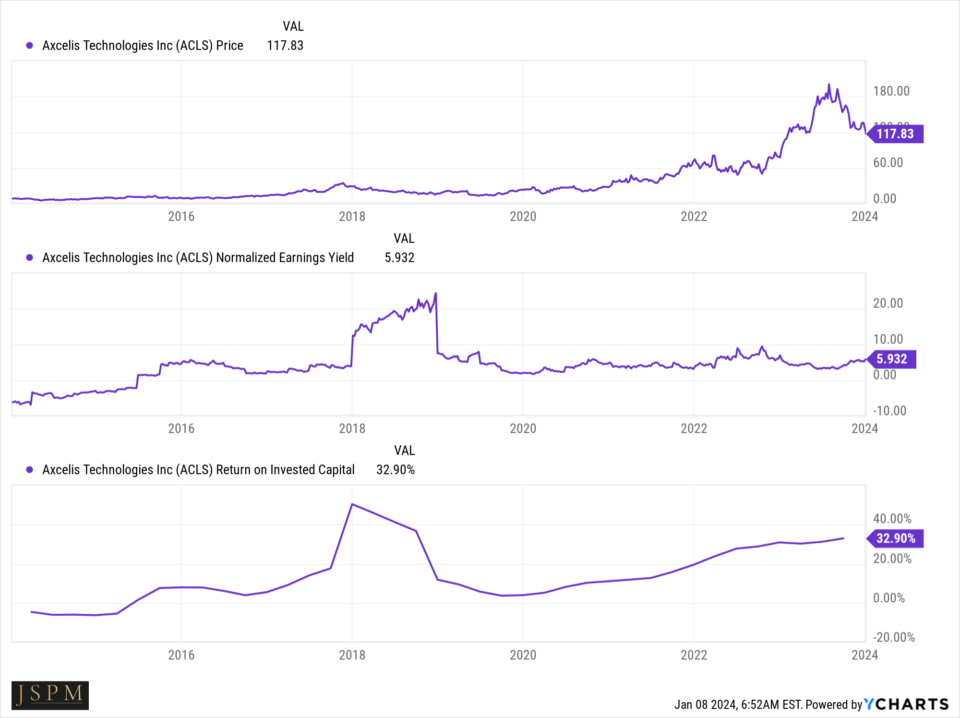
In the above image created with YCharts and moving from bottom to top, we can see trends in ROIC, normalized earnings yield, and finally price. Starting with the bottom panel, you will notice the uptrending ROIC over the past 4 years and currently above 30%. This satisfies our criterion of above average return on capital. The middle panel of normalized earnings yield shows ACLS sitting at just under 6% at the current price. As a reminder, earnings yield is what we get for what we are paying. The estimated earnings per share (EPS) for 2023 is $7.27. If we take 7.27 / current stock price of $117 we get approximately 6%. This can be easily compared to other companies under consideration as well as to risk free instruments such as Tbills and notes.
It is important to remember that in comparing earnings yield to risk free rates that only one of the two “coupons” are guaranteed, and that is of course the one attached to the Tbills or notes. Common stock guarantees don’t exist, which is why stock prices are volatile. What you are likely guaranteed however, is that a company with a durable competitive advantage or “moat” will grow their per share earnings over time. As a common stock shareholder, you are entitled to a portion of those growing earnings.
The universe of available investments is vast both here and abroad. When it comes to individual stock selection, (as opposed to indexing) one needs a tried and true method of uncovering a list of those very special companies with a durable competitive advantage. The ROIC (or ROE if you prefer) is there to guide us. And provided we don’t pay too high of a price from the outset, you will be well on your way to building a portfolio of quality companies acting as a springboard to your future wealth creation. Good luck!
Trent J. Smalley, CMT
JSPM LLC is available for portfolio consultations. Visit our website: https://jspmllc.com/
Please remember that past performance may not be indicative of future results. Different types of
investments involve varying degrees of risk, and there can be no assurance that the future performance
of any specific investment, investment strategy, or product made reference to directly or indirectly in this
newsletter (article), will be profitable, equal any corresponding indicated historical performance level(s),
or be suitable for your portfolio. Due to various factors, including changing market conditions, the content
may no longer be reflective of current opinions or positions. Moreover, you should not assume that any
discussion or information contained in this newsletter (article) serves as the receipt of, or as a substitute
for, personalized investment advice from JSPM LLC. To the extent that a reader has any
questions regarding the applicability of any specific issue discussed above to his/her individual situation,
he/she is encouraged to consult with the professional advisor of his/her choosing. A copy of our current
written disclosure statement discussing our advisory services and fees is available for review upon review.