by Trent Smalley, CMT | Nov 29, 2016 | Stock Market Analysis, Stock Market Trends, stocks to buy
Traders “got carried away.”: http://www.marketwatch.com/story/us-stocks-on-pace-for-muted-open-as-analysts-argue-traders-got-carried-away-2016-11-29 What if OPEC Can’t Reach A Deal?:...

by Trent Smalley, CMT | Nov 28, 2016 | Stock Market Analysis, Stock Market Trends
I believe the chart of $YNDX would suggest a breakout could be imminent, and I like the risk reward here. Here is what I see: A. Head and Shoulders bottom. Many times the breakout from this bullish pattern comes back to retest the breakout level as it looks to be...

by Trent Smalley, CMT | Nov 25, 2016 | Stock Market Analysis, Stock Market Trends, Technical Stock Market Analysis
Back on November 15th I blogged about $FCX getting to $20: https://omahacharts.com/single-post/2016/11/15/Freeport-FCX-to-20-and-Beyond I was recently asked if it was too late to get into $FCX if you didn’t already have exposure as it has run up to above $16...

by Trent Smalley, CMT | Nov 21, 2016 | Stock Market Analysis
This past weekend, TD Ameritrade released a couple of powerful new tools in its Think or Swim platform. One that I am exceptionally excited about is the new “Earnings Analysis” Tab which you can find under the Analyze drop down. If you are an equity...

by Trent Smalley, CMT | Nov 18, 2016 | Stock Market Analysis, Stock Market Commentary, Stock Market Trends
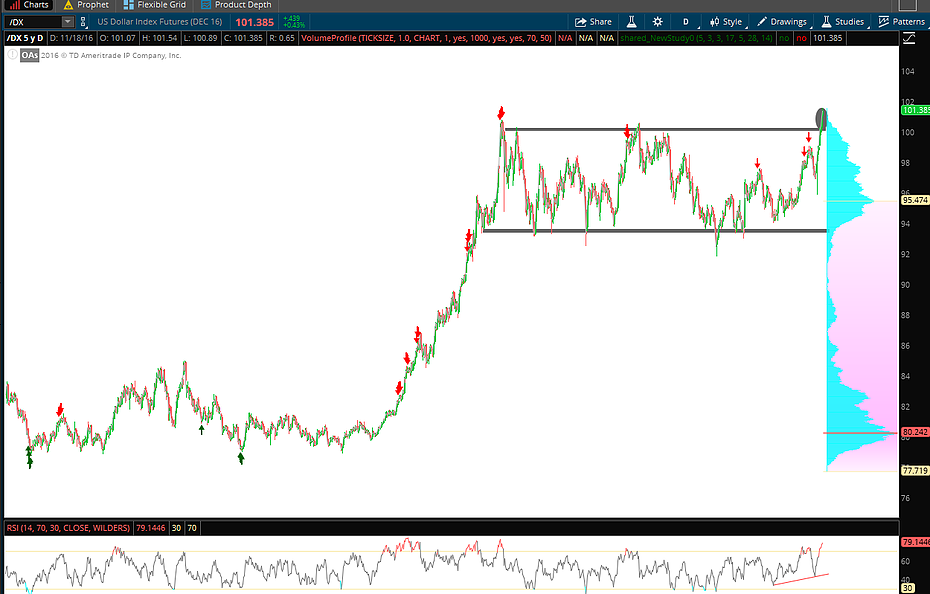
The United States Dollar Index has broken out above its nearly two year Horizontal Consolidation Region (HCR). Going back to the start of 2015, the /DX has traded in a range between $93 and $100 but has broken through the overhead resistance level. The upward breakout...


