Back on November 15th I blogged about $FCX getting to $20:
https://omahacharts.com/single-post/2016/11/15/Freeport-FCX-to-20-and-Beyond
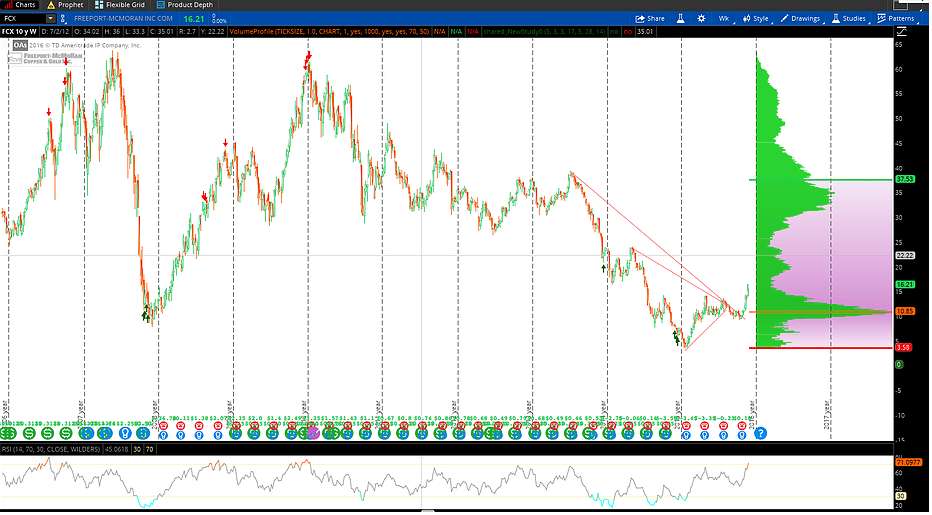
I was recently asked if it was too late to get into $FCX if you didn’t already have exposure as it has run up to above $16 quickly. I am adverse to buying any stock after it has had a huge run, but this may be an exception. Here’s why:
Not only was $FCX near 10 year lows, the range from the beginning of the Symmetrical Triangle Pattern is approximately 20 points. When you have a breakout from a symmetrical triangle you add the range to the point of the breakout to assess a possible measured move. The apex and breakout occurred at approximately $11 so I would expect a target of about $30. This target also coincides with past resistance as well as the 78.6% Fibonacci Level from the 2014-2015 decline.
I am looking for a pullback to $15 to add January calls to buy myself some more time. My December calls are running at an unrealized gain of just over 600% currently.
Will continue to update this position as well as others.
Have a nice long weekend all!
@Omahacharts