When analyzing the chart of a stock you often will come across a gap, or an empty space where the stock made a significant move. These empty spaces occur between one trading session and the next due to a material event that affects the stock such as an earnings announcement or merger agreement. In order for a gap to occur, there has to be a large enough difference in the opening price of a trading period that it doesn’t fall within the previous day’s trading range.
For example, if a stock is trading at $20 today and tomorrow it opens at $25, there will be a gap, or white space in the chart of the security. No trading took place between $20 and $25.
While there are several well known types of gaps, today we will focus on one in specific called a continuation gap. (aka runaway gap,measuring gap).
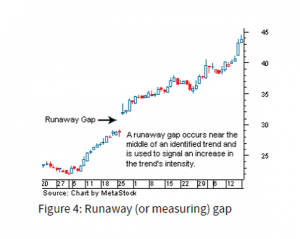
In the above example taken from Investopedia.com you can see that the uptrend had been identified from around $20 up to just under $30 before gapping up. When you are long a stock that forms a continuation gap, you can often expect to enjoy further upside. One may make the case that Apple $AAPL is in a continuation pattern as shown here:
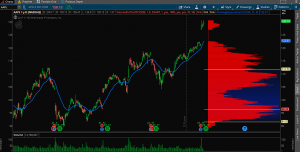
After its recent earnings announcement, Apple gapped from about $121 to $126. Since then it has continued to run higher to $130 suggesting that the continuation gap theory is underway.
The Psychology of the Continuation Gap: Why does this happen and how can we use it to try and figure out where Apple is going next?

The most recent uptrend in Apple started at about $108 back in early December. If I am looking to get into an Apple position and have been waiting on the sidelines for an opportunity to buy a dip, I haven’t gotten one since early December. Now I (as well as many others looking to get in) are afraid we are missing a big move and decide now is the time to buy. This increased buying will create a chase, gap the stock up and continue the uptrend.
Now that we have taken a position in Apple and the stock has rallied in our favor, we need to have an exit strategy to ensure we capture gains and practice prudent risk management. Since we believe we have a continuation gap on our hands, we can use that to project a potential price target for where we will look to take profits. Remember at the start of the article, I mentioned that the continuation gap was also known as a measuring gap? Here is why that is important:
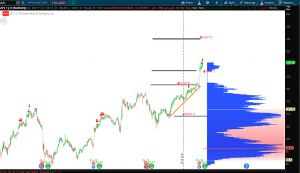
Our distance defined earlier in Apple went from Point A to Point B ($109 to about $122) before gapping up to $127. We can take the distance from Point A to Point B, add that distance to Point C above to get an estimate of our measured move. Being conservative, and going with about a $12 move from Point A to Point B we get $127 + $12 or $139 as our price target. Approaching $139 we would look to book gains on at least a part of our position or trail a stop to make sure we capture profits.
Thomas Bulkowski over at ThePatternSite.com did some work on types of gaps and how long it took to fill those gaps, and he found that in bull markets, it takes the continuation gap an average of 98 days to fill. With that information we know that we can expect to continue to profit from our Apple position. If however, the stock would manage to drop and begin filling in the recent gap created after its earnings breakout, we may have an Exhaustion Gap on our hands. This is another topic for another article, just beware that we would look to sell Apple in the event it would retrace the gap in about 8-10 days. In this particular circumstance I don’t see that happening.
@omahacharts