The bond market is wondering……
Roughly eight weeks ago the stock market was experiencing selling pressure not seen in many years – I would argue a decade. Ever since, things have changed; pundits would tell you “we’re back to normal” – because, of course, up = normal for most market observers. Yet there is something that suggests we are not quite back to “normal” and there are pockets of the market that are questioning the current advance.
We’ve explained a while back how bond trading is almost entirely dominated by professionals and what that means in the relative performance swings between asset classes but here’s a quick review. Professionals depend on trading profits to make a living. They are better educated and have superior analytical abilities that may allow them to have a competitive edge in the trading game. For these reasons they tend to be the “smart” part of the market, i.e. the part that is more informed, more astute, more forward looking and generally more correct. When they send certain messages through the actions they take, everybody would be well advised to take notice. Their behavior tends to be a predictor of things to come.
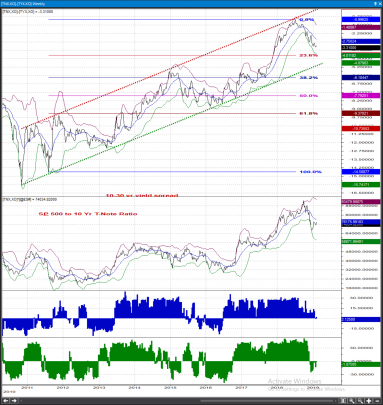
In that regard, the bond market at the moment is less than committed to the current stock market advance. For one thing the EuroDollar futures now hint at an inverted curve going into Sep 2020 (each successive maturity till then shows higher price and lower yield compared to the immediately preceding one). This reflects rate hike expectations and can of course shift; but that is just to say nobody seems to think the current rally is enough to get aggressive growth and FED moves in full gear.
More importantly, the 10-30 Year Yield has yet to turn up. It remains above key support – like we said it would – but finds it difficult to get going to the upside. This tends to act like a drag for the Stocks / Bonds ratio which is itself trying to stabilize and establish more of an uptrend. The good news I guess is that our scoring model currently shows readings for the spread and the ratio that would be associated with mature corrective pullbacks; but as it stands now nothing in the professionally dominated bond market suggests the current stock market rally is to be blindly embarked.
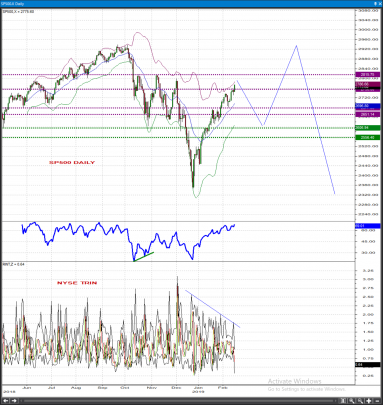
The proximity of the previous corrective peak at 2820, the overbought nature of most momentum studies and the diverging volume and breadth are strong arguments to believe a pullback is imminent. A push below 2730 / 2680 would confirm it was already underway. We continue to believe the logical thing to happen is a retest of 2450-2550 before a reasonable, low risk buying opportunity presents itself.
 [/vc_column_text][/vc_column][/vc_row][vc_row][vc_column][vc_column_text]
WEEKLY PICKS
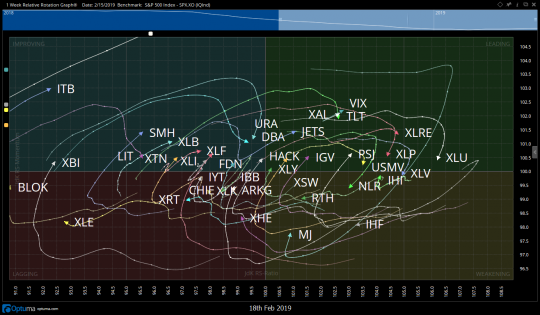
Last week US Equity Markets continued higher and each of the major indexes (SPX, NDX and RUT) recaptured their 200 day EMAs. Slowly but surely we seem to be moving back into a business as usual environment as heavy volatility wears off and earnings season comes to a close. As we look toward spring, I think we can count on the return of a stockpicker’s market. Volatility is falling which should lead to a higher dispersion among individual stocks. ATRs also are headed lower in the overall indexes as the speed of markets returns to historically normalized levels.
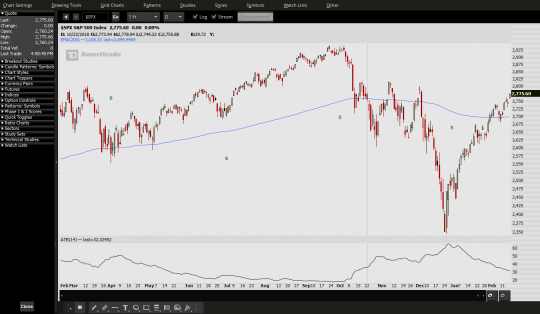
Before we get to this week’s risk/reward setups, a couple of words about Average True Range (ATR).
I see ATR often being misinterpreted as an increased ATR = Bad and lower ATR = good. We must use caution in these sorts of blanket statements. Some trading styles thrive in a high ATR environment while others struggle, and what is good for one may not be so good for another.
ATR is simply a measure of the level of volatility a stock, commodity or other risk asset is experiencing. In plain terms, is it currently moving more or less than normal, gaining or losing ground quicker than average. High ATR levels in stocks may mean more overnight gaps, and in commodities an increased limit up / limit down environment. It tells nothing about direction. Its usefulness to a trader ranges from assisting in entry and exit strategies, as a criterion in screening for stocks for certain volatility profiles and my personal favorite which is position sizing and asset allocation.
In lower ATR environments I am more comfortable having on a greater number of positions as well as full position sizing. As a derivatives trader, I might hold 10 option positions in a normalized ATR environment versus only 3-5 in a high ATR environment. In other words, a greater percentage of my overall portfolio would be allotted to options in times when market speed is slow. It is one indicator I would look at first if I had been away from the market for several months and wanted to know what kind of environment I was sitting down to.
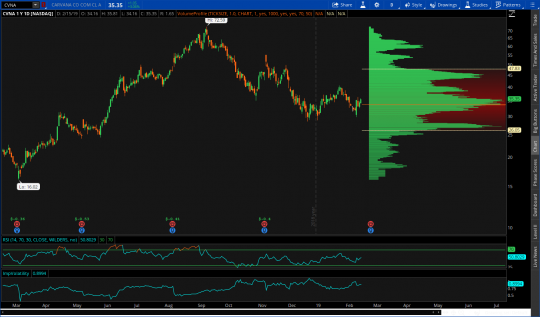
CVNA
Since its highs in September of last year, CVNA has come in to retrace approximately 78.6% of the major uptrend of 2018. It bottomed twice near $29 and a third time near $30 putting in a major bullish candle on heavy volume. This indicates a strong buyer near these price levels. Recently price has recaptured the one year volume point of control. With support from this as well as the initiative candle we have a strong base of support from which we feel comfortable taking a trade from the long side. Note that earnings are at the end of next week and implied volatility is on the higher side here should you choose to take options premium.
| DIRECTION | BUY ZONE | SELL ZONE | RISK/REWARD | VEHICLE |
| LONG | 33.50-34 | 43-44 | -2/8 | OPTIONS |
GLYC
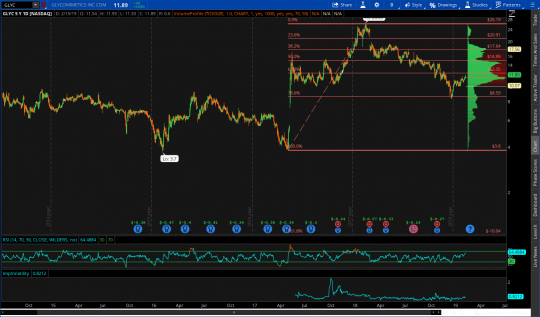
The most recent strength in the biotech sector has shown the market again has appetite for risk. Picking stocks in areas of the market exhibiting relative strength increases our chances of success from the long side. GLYC is both a biotech stock as well as a stock that has recaptured its 5 year volume point of control. This indicates the buyers have taken control and that we should err on the side of the bulls until proven otherwise. I think chances are strong that GLYC has completed an inverse H&S reversal pattern and will continue to add to the upside in the days and weeks to come.
| DIRECTION | BUYZONE | SELLZONE | RISK/REWARD | VEHICLE |
| LONG | 11.50-12 | 14-15 | -.50/2.00 | OPTIONS |
FEZ
| DIRECTION | BUY ZONE | SELL ZONE | RISK/REWARD | VEHICLE |
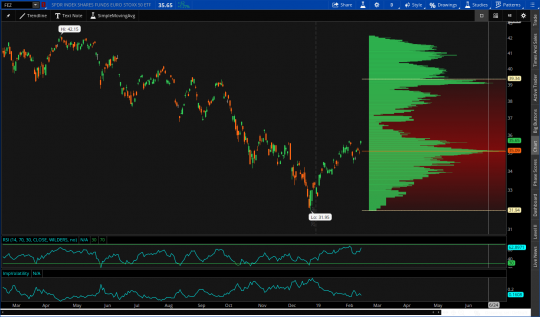
| LONG | 35-35.50 | 39-39.50 | -.50/3.50 | OPTIONS |
The Euro Stoxx 50 ETF looks to be breaking out from an inverse head and shoulder pattern with room to move to the upside. This won’t be a quick trade but the risk reward is there and this will be an ETF I add to my long term holdings via ATM options or stock. Use the one year volume point of control as your support level and play for the Value Area High upwards of $39.
CHRS
| DIRECTION | BUY ZONE | SELL ZONE | RISK/REWARD | VEHICLE |
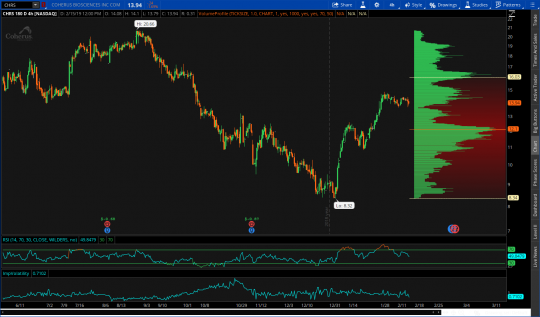
| LONG | 13.75-14 | 15.50-16 | -.25/1.50 | OPTIONS |
CHRS is another biotech named primed for further upside. So far in 2019, it has had two initiative moves higher and two healthy pullbacks to digest gains. I think we see one more move higher up through the higher bound of the value area in the mid $15s. The risk reward is favorable and the strength surrounding it in other biotech names should assist the bulls in taking this higher by several percent in the coming days.
KURA
| DIRECTION | BUY ZONE | SELL ZONE | RISK/REWARD | VEHICLE |
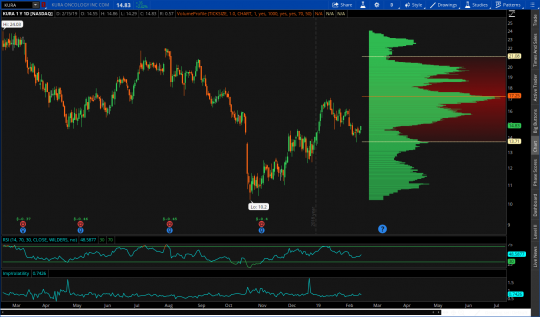
| LONG | 14.25-14.75 | 17-17.50 | -.50/2.00 | OPTIONS |
A biotech heavy list this week ends with KURA. Like CHRS, KURA has had a couple of initiative moves higher as bulls were in discovery mode. We were in the midst of healthy pull back number two before a strong day Friday. From here I think price climbs upwards of $17 and back toward highs put in nearly one month ago.
 [/vc_column_text][/vc_column][/vc_row]
