
Shares of Chinese tech giant Baidu are nearing what I project to be the beginning of a major move. A major move in which direction? If I knew the answer to that, I sure as hell wouldn’t tell you. 🙂 Let’s take a look at what the price action is telling us.
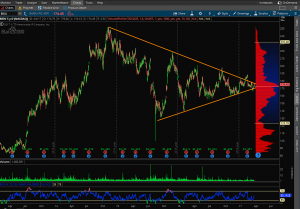
Pictured above is a daily chart of $BIDU showing a defined Symmetrical Triangle Price Pattern. This particular pattern is one of supply and demand indecision, or equilibrium. Price is in what some would call “acceptance” mode as the general consensus of value between bulls and bears is being decided. A symmetrical triangle pattern is also known as a coil or contracting wedge pattern. No matter what name you give it, from this particular pattern you can often expect to get a big move once price breaks out above or below the converging trendlines.
Because we can never be sure which way price may break out of particular patterns, it would serve us to wait until the market “shows us its hand” (I hate when people say that) or breaks out in one direction or another. The problem with this is then we are forced to buy up if there is a rally, paying a higher price for what we could have gotten cheaper had we been correct in anticipating the move. Better gains come if we are correct in our anticipation so I’ll try and make a case one way or another.
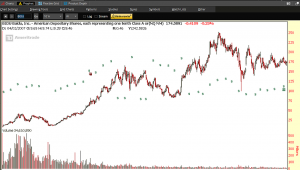
More often than not, in symmetrical patterns the breakout direction is in the direction of the prior trend established before it entered an acceptance phase. Looking at a long term chart, $BIDU was in an uptrend before coiling:
Taking a look at Volume Profile as well as VWAP, we can see that price is currently being agreed upon:
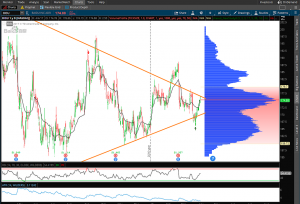
We are sitting right on VWAP / and near point of control, and are nearing the apex of the triangle. I would argue that the path of least resistance here is to the upside, as there is a lot of support beneath $BIDU from $160 to $170.
Knowing that these patterns tend to act as bullish continuation patterns, that the stock is in a general long term uptrend, and that there is a good amount of support underneath the current price, I would trade it from the long side or not at all.
When I mentioned earlier that this stock has the potential for a major move, by major I meant $120 move major. You can project symmetrical triangle moves by taking the largest part of the range when consolidation began and adding that to the breakout level. In this case the range from $130 to $250 where the triangle begins is the $120. Should the triangle breakout above, and confirm you would add the $120 to the breakout point at $180 (give or take).
Price target approximation in a perfect world: $300.
In sum, I am projecting a breakout of $BIDU outside of the current symmetrical triangle to the upside. Upon the breakout I fully expect for the stock to pull back to the breakout area to retest, and shake out any weak hands on its quest towards an upside price target of $300. It won’t go straight to $300 so don’t email me on every pull back along the way to tell me I’m wrong. Stocks don’t move in straight lines. However, with the coiling this name has seen, it has the propensity to move quickly once the initiative move is made, sending it into price discovery mode.
My skin is in the game and has been for a while. I am long April 175 calls and will be looking to roll those / calendar spread to later expiry dates as well as higher strikes.