
Heading into a short trading week and the unofficial start to summer, there are a few charts we will want to keep an eye on in effort to keep a pulse on the overall tone of the market.
A. Weekly RRG
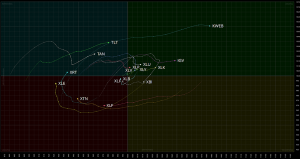
The weekly RRG shows risk off assets $TLT, $XLU, and $XLV have made a move into the Leading Quadrant, or near to it which should alert us that a rotation into more defensive areas could be upon us. However, we also see the $IGV (Software stocks ETF) as well as $XLK and our old favorite $KWEB still in the leading quadrant as well giving us somewhat of a mixed signal here. At minimum, we want to keep a close eye on the comparison of risk on vs. risk off assets going into this week.
B. (XLY/XLP)
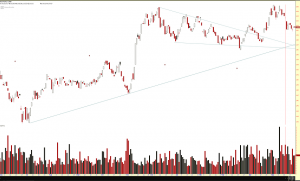
A ratio chart of Consumer Discretionary to Consumer Staples Indicates we may be coming in to retest the upwards breakout of the recent consolidation pattern. If we expect to see risk assets continue to outperform into the summer we will want to see price find support near the 1.58-1.59 region of this intermarket chart.
C. $QQQ
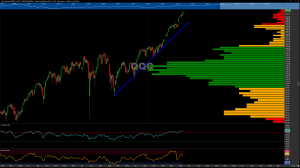
The overall equities market has continued to trade higher thanks in part to strong overall out performance by the NASDAQ as compared with the Russell, Dow and S&P 500. This significant outperformance by the NASDAQ isn’t likely to continue uninterrupted for much longer. Taking into account price history going back to the beginning of 2014, we can see that the $QQQ has entered into 3rd standard deviation territory with respect to its 2.5 year volume point of control, and the Optex Bands show price entering a level of possible buyer exhaustion. I would expect a pullback in the $QQQ in the near future, meaning the S&P / Russell will need to do the heavy lifting if we want to see the major indexes continue to trade higher.
Keep an eye on any trends you may see in the top performing and worst performing stocks this week. This could give a clue as to risk appetite as we move into the slow summer trading months.