
If you are looking for a more speculative energy play to add to your portfolio for the first half of next year, $HLX is one you may want to consider. With a Beta of around 2.75 this is a volatile play that should display a strong positive correlation with Crude Oil. If stocks like BP, Exxon and Conoco are too “old man” for your taste, $HLX may do a better job keeping your interest. Let’s take a look at a chart and break down what we like about this one here.
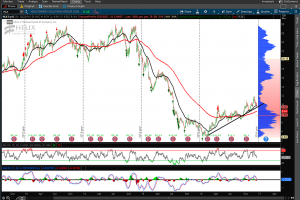
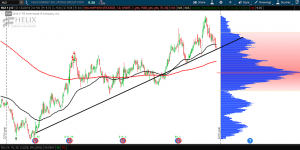
A. An uptrend has recently been established since the stock found its lows all the way down at around $2.60 per share. Since then we can see a definite uptrend as demonstrated by the series of higher highs and higher lows.
If you are looking for a more speculative energy play to add to your portfolio for the first half of next year, $HLX is one you may want to consider. With a Beta of around 2.75 this is a volatile play that should display a strong positive correlation with Crude Oil. If stocks like BP, Exxon and Conoco are too “old man” for your taste, $HLX may do a better job keeping your interest. Let’s take a look at a chart and break down what we like about this one here.

A. An uptrend has recently been established since the stock found its lows all the way down at around $2.60 per share. Since then we can see a definite uptrend as demonstrated by the series of higher highs and higher lows.

B. Moving average cross (Is that still a thing?). The shorter term 50 day EMA crossed above the 200 day EMA from below. Some like to call this “The Golden Cross.” Those that follow this as their sole trading strategy however are sure to experience extreme pain and agony as they watch their trading accounts being left in tatters. Anyone with any level of technical sophistication doesn’t follow MA Crossovers. This is just an observation here and it’s certainly not bearish. What is more important is the slope of the longer term consensus of value – the 200 day EMA. It is sloping upward. Also bullish.
C. Volume Profile leaves a gap for $HLX to travel from the mid $10s to $16 with little resistance. That coupled with the fact the name has a 7% float short means some extra upside in the event of a short squeeze.
D. From a tactical perspective we take a look at a shorter term time frame to look for a good spot to take an entry. Here is a 60 min chart showing 30 days of price action.
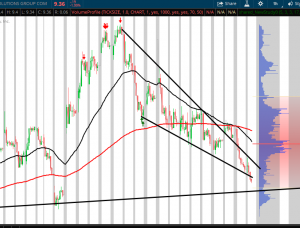
One of my favorite patterns to trade is taking shape here (Falling Wedge Formation) as the stock retraces back to come into it’s primary uptrend line we saw above. If you can get the stock right around $9 that is where I would be looking to take the long. For risk management purposes I would exit the trade should the stock take out the lows it put in early in November around $8.30.
Alerts have been set to notify me of a retrace to just above $9.
Any questions?
@omahacharts on Twitter