
Part of being a successful trader, is being able to keep a “pipeline” full of ideas so that you aren’t forcing trades due to lack of idea flow. Being a market technician, the bulk of my time is spent looking at charts, but I utilize lots of other resources as well to get a mosaic view of the market environment. At minimum, 90% of the trades I take are planned out days or even weeks in advance.
One of the tools I use everyday is Exodus Market Intelligence by iBankCoin. It is a staple in my everyday work flow for both long term investing and short term trading.
(I don’t work for iBankCoin and can’t get you discounts by the way, I pay the monthly fee like everyone else.)
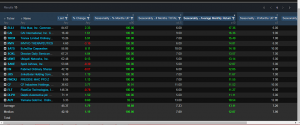
One way I use Exodus for idea generation is to set up a personal screen within the software each month that gives me the Best Seasonal Performers by month. Depending upon the market environment, my criterion may change a bit but I like to filter for stocks and ETFs using the following:
A. Seasonality % of Months Up – Over 90% meaning these stocks are up for the month of February over 90% of the time.
B. Seasonality # of Months Total – Over 5. In other words I look for ones that have over 5 years of historical data.
C. Seasonality Average Monthly Return – Over 10% meaning I am looking for stocks that on average do at minimum 10% in the month of February.
So, this will return to me the following:
Stocks and ETFs that have at least 5 years worth of data, that are up at minimum over 10% in the month of February 90% of the time. Pretty powerful right?
Here is what platform has returned for February…
Once I have the above data, I can further analyze in Excel or another platform like Matlab. I also look at the charts of each one to see the technical structure of the returned results.
Because the list for February is only 15 stocks out of the universe of over 5,000 the charting analysis is quick. Out of the returned 15 which I would put on a watch list, I’ll pick 2 I am interested in right here.
1. $ELLI – In the past 6 years, up every year in February for an average monthly return of 17%.
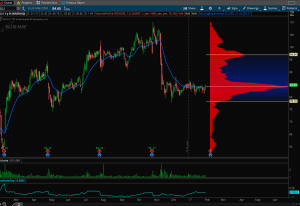
Technically, a nice period of consolidation is taking place which is going to break soon. Easy to risk manage here.
2. $JKS – In the past 7 years, up every year in February for an average monthly return of 11.67%
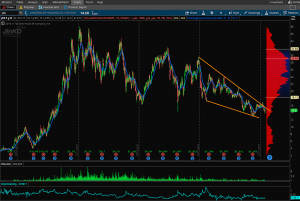
Not much more to say here. I like it on a technical and seasonal level.
Is it possible that even after my brilliant technical analysis and those pretty charts along with the powerful seasonal trends returned by Exodus that these stocks lose money in February? Of course it’s possible. But, pairing several methods of analysis to find names that exhibit technical patterns I look for with statistical data makes a powerful case for the above stocks in the month of February.
@omahacharts