[vc_row][vc_column][vc_column_text]
The phrase, “Buy The Dip” (#BTD) is so well known to the active money management community that it likely shows up in abbreviated form on someone’s personalized license plates. Further emphasis is used at times as well in #BTFD (use your imagination). In bull markets, this phrase is a prudent rule of thumb; buy strong stocks supported by stellar fundamentals in uptrends when they take a breather.
An example of a recent stock I did just that is that of $INTU:

INTU made a high in March and pulled back along with the greater market in May, but quickly resumed its powerful uptrend higher when the market regained its footing. When it underwent a slight pullback putting in a handle (circled above) I got involved in my IRA. It’s been a great win thus far and I continue to hold.
But when will BTD cease to work? When will the US Equity Markets have a more major decline in store for us? Wouldn’t it be nice if knowing were that easy? Turns out trying to pick market tops is a senseless endeavor, held near and dear only to armchair quarterbacks whose money is likely buried in a hole in the ground in their backyards. But, those of us whose financial livelihoods are invested in markets would benefit from a trustworthy signal alerting us ahead of time of tumultuous waters.
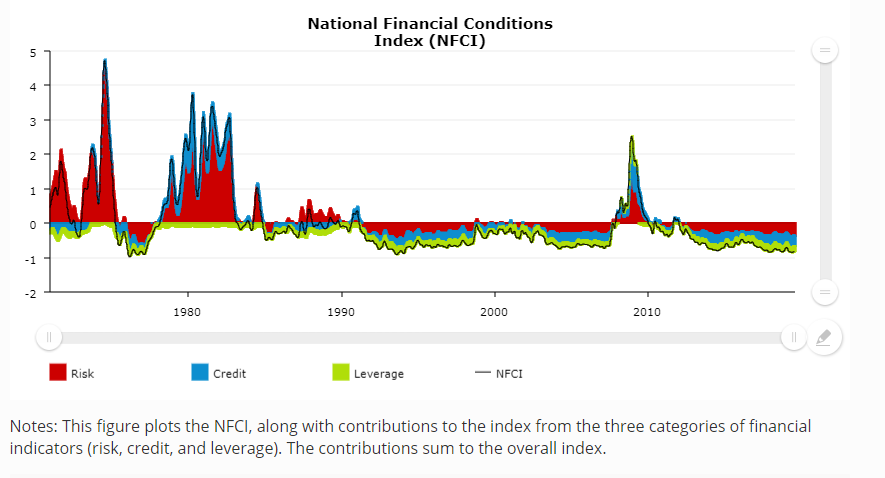
This week on CNBC, Chief Market Strategist Tony Dwyer of Canaccord Genuity detailed how corporate credit spreads (High Yield Debt relative to treasuries) can be a signal of credit shutting down which can stifle a bustling economy. He goes on to mention that anyone can monitor this on a weekly basis via the Chicago Federal Reserve Website. There you will find the National Financial Conditions Index which has three sub indices measuring over 100 indicators of credit stress in financial markets. Dwyer states that the only time he has seen holes in the bullish narrative is when these three indices begin to spike signaling problems in the credit markets. A brief look is in the chart below:

The Index Points to Looser Financial Conditions in Week Ending July 19
The NFCI ticked down to –0.84 in the week ending July 19. Risk indicators contributed –0.38, credit indicators contributed –0.30, and leverage indicators contributed –0.16 to the index in the latest week.
The NFCI and ANFCI are each constructed to have an average value of zero and a standard deviation of one over a sample period extending back to 1971. Positive values of the NFCI have been historically associated with tighter-than-average financial conditions, while negative values have been historically associated with looser-than-average financial conditions. Similarly, positive values of the ANFCI have been historically associated with financial conditions that are tighter than what would be typically suggested by prevailing macroeconomic conditions, while negative values have been historically associated with the opposite.
Obviously this indictor is not meant to time the market on a daily or even weekly basis. This isn’t someone from the financial media using a scare tactic to shake you out of your equities. This is a more of a major crises signal that trouble lies ahead and one that I don’t see many folks mentioning so I wanted to bring it to your attention.
Clip from CNBC Fast Money: Investors Should Buy The Pullback
Trent J. Smalley, CMT
[/vc_column_text][/vc_column][/vc_row]
