
Back on November 16th of last year, I introduced you to a sentiment chart that hangs above my desk, taken from Justin Mamis’s “The Nature of Risk.” In that, I speculated that the $XBI ETF had entered the “Aversion” Stage of its cycle.
You can read that post here:
$XBI Trade Setup November 16th
After posting that article I set an alert via my ThinkorSwim platform to notify me if $XBI traded back to its $60 level which was a Fibonacci Level (An article on Fib is coming, so temper your enthusiasm), as well as the round number $60 psychological level. Once the alert was sent I took a starter position in $XBI calls.
![]()
The above is read: $XBI January 2017 $60.00 calls bought at $2.33 ($233 dollars per call) on December 28, 2016. Position sold today January 10th, 2017 $5.95 ($595 dollars per call). Generally I would not take a position near the end of the calendar year as I don’t like the risk of holding over a holiday and into a new year. This was an exception so I took a small position. Just two contracts.
Yesterday, my price target was hit ($65) and today I took the trade off.
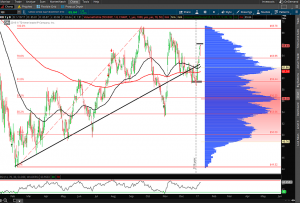
Chances are strong that I exited this trade too early, and we will see $XBI trade up towards $69. That is okay, as the position had grossed over a 154% gain in a short period of time.
This is an example of how you can use options to gain leverage, and define risk. Combining risk management strategies from a technical perspective while utilizing options is the best way I know how to achieve out sized gains.
The Bottom Line: The $XBI Trade was a base hit to get my year off to a good start. The first tee jitters are out of the way. Let’s hope on hole number two I don’t shank a powerhook 2 holes over, hitting an elderly gentlemen as he prepares to line up his putt.
@omahacharts