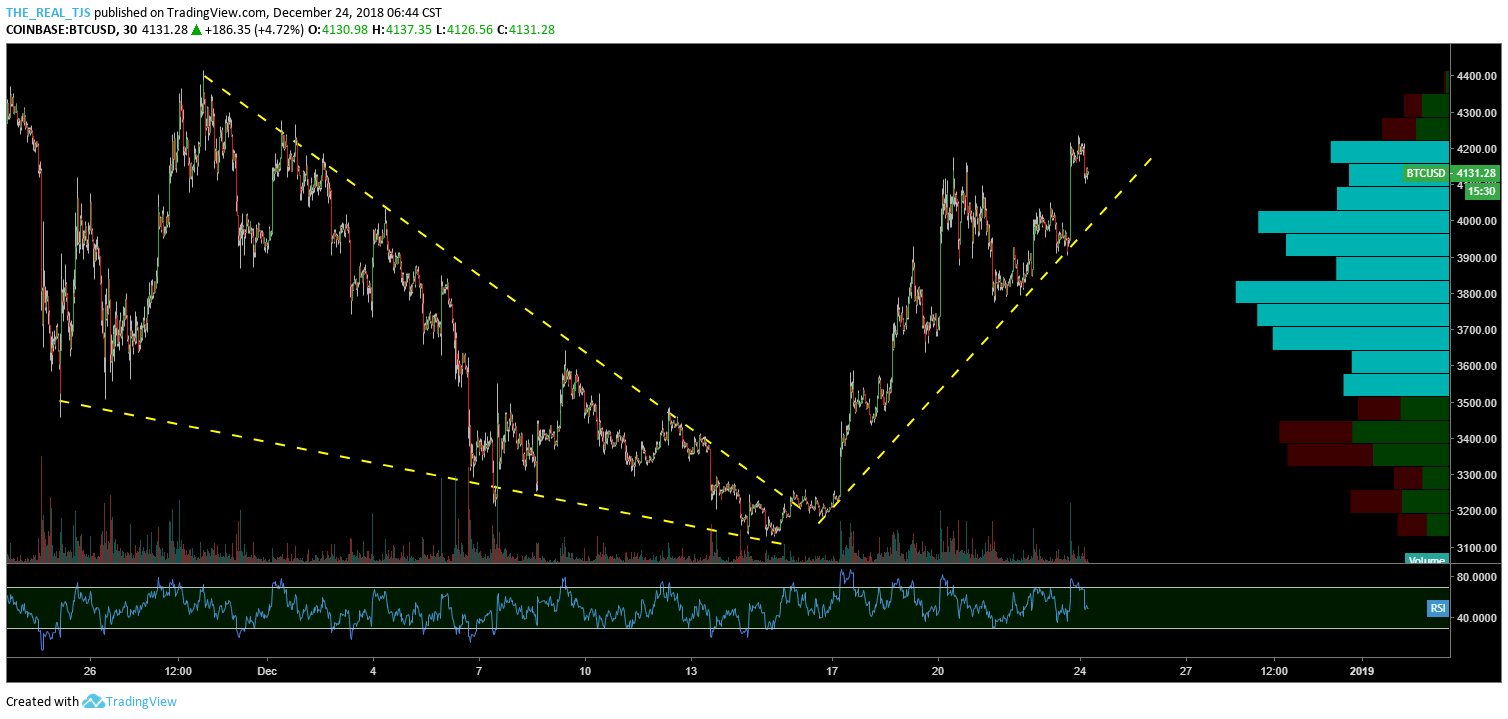
Last Wednesday I did a post on the recent strength in Bitcoin, highlighting a near term profit target of approximately $4200. This has been achieved swiftly.

There is no asset class which adheres to technicals and sentiment / investor psychology than cryptocurrency. When I look at Bitcoin, Etherum, Litecoin, Ripple, etc. I am armed with my knowledge of technicals as well as the old sentiment chart I’ve made reference to many times on this blog.
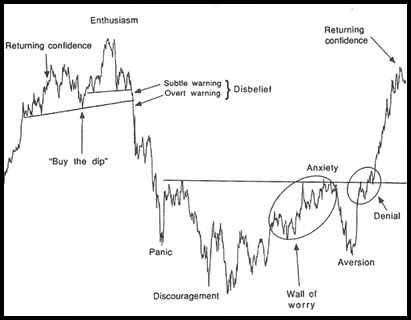
First, the sentiment cycle of a risk asset:

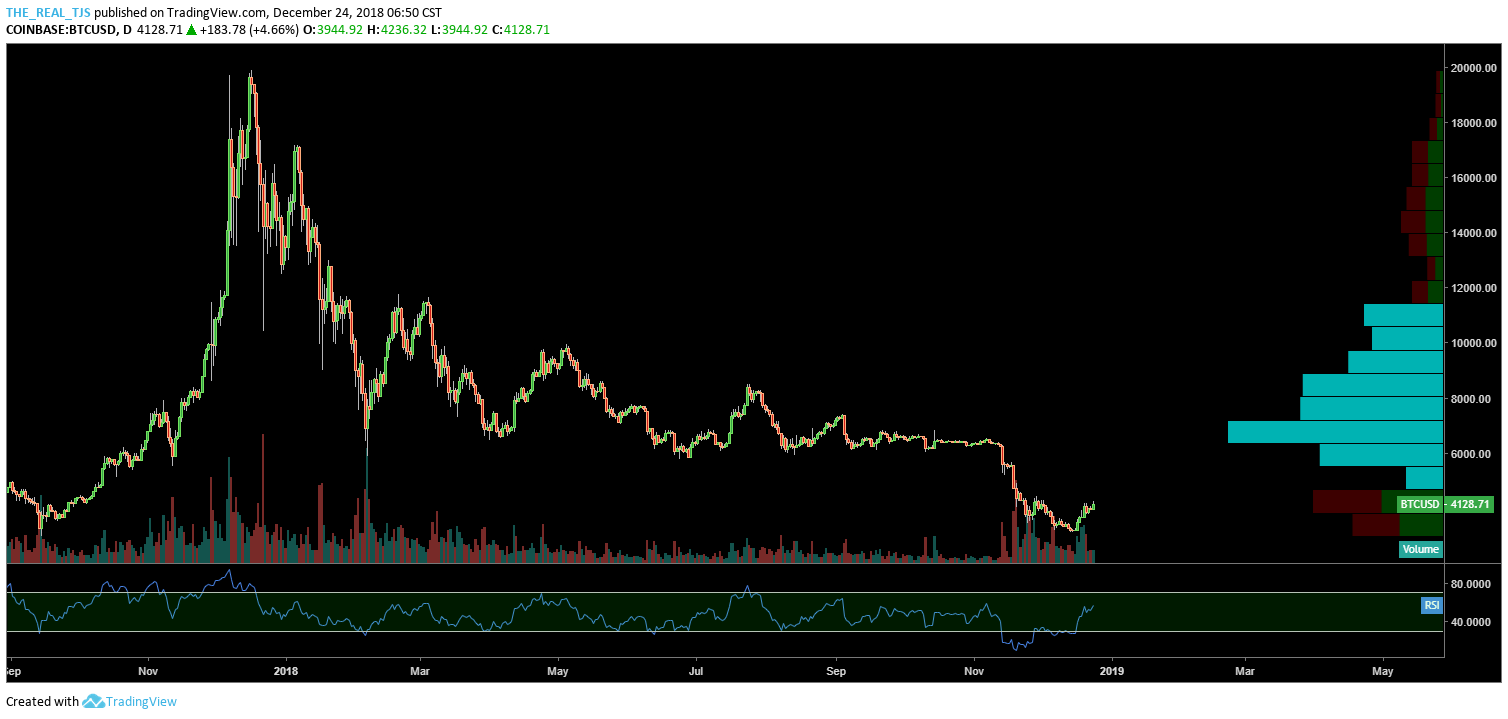
Followed by a daily chart of Bitcoin:

While it doesn’t follow perfectly, it is easy to start with finding enthusiasm. That came late in 2017. From there, we can see three major sell offs or legs lower, disbelief, panic and a final drop into discouragement. From here we have a prolonged period of discouragement. I would argue that the recent bullish price action is the beginning of the wall of worry which could take us back towards the $7500-$7800 level before overhead supply overpowers bulls, sending BTC into aversion.
As the discouragement phase was prolonged, I would expect to see the same in wall of worry. Buyers will be slow, methodical and hesitant as the fierce selloff is still fresh in investor’s minds. I am a Bitcoin owner from just under $2000 and have been on this wild ride in sentiment over the past year. It is the first real bubble I have personally participated in and has allowed me to go through each of the sentiment cycle stages.
Great learning experience with real money at risk.
OC
