Let’s start with a victory lap and a smidge of shameless self-promotion shall we? One of my first blogs of 2019 was entitled “Close Your Eyes And Start Buying Apple.” I hope at least one of you heeded said advice for if you had you are up handsomely. That blog was done in the midst of the short lived bear market we saw in Q4 of 2018. I remember telling my family over the Christmas holiday that the selloff seen late last year was overdone. Once that became obvious, I started a fresh position in the stock with the most dominant balance sheet the world has likely ever seen, Apple.
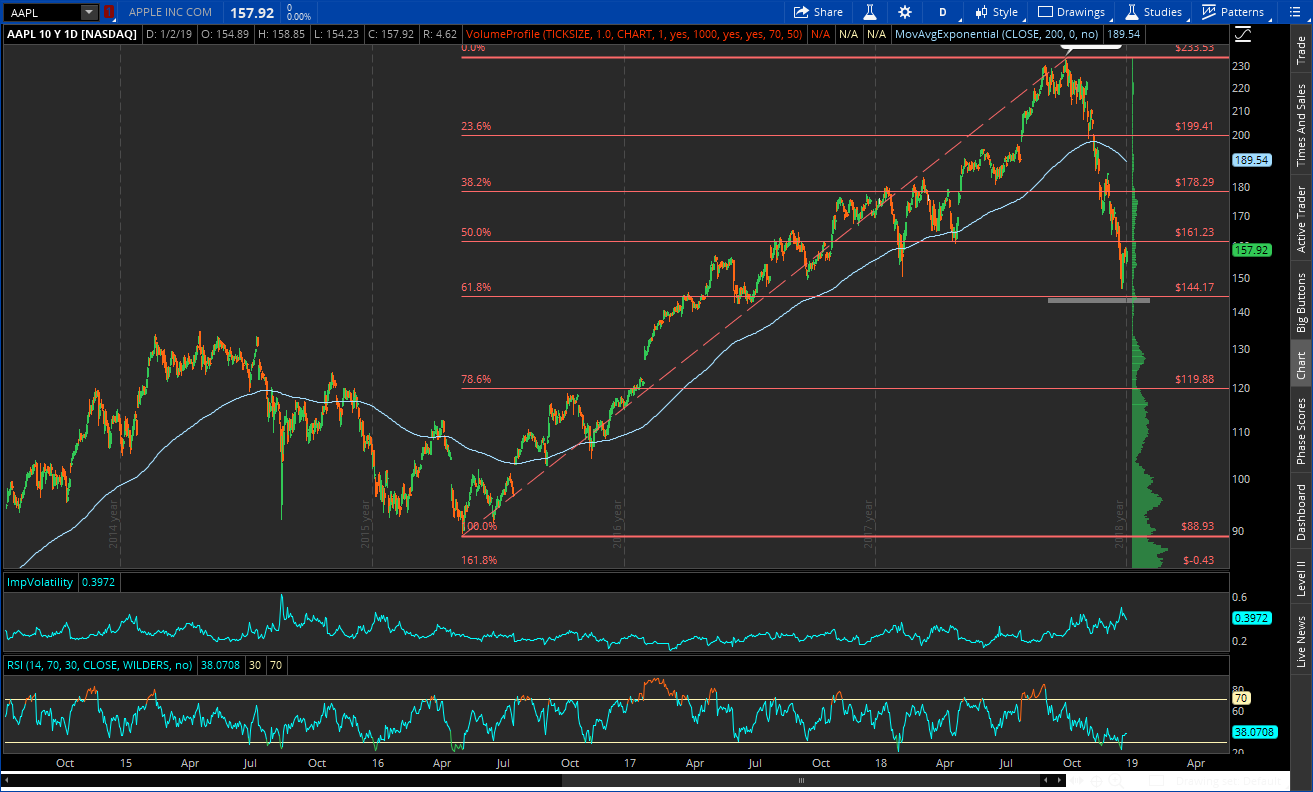
My entry point was based on Fibonacci analysis:
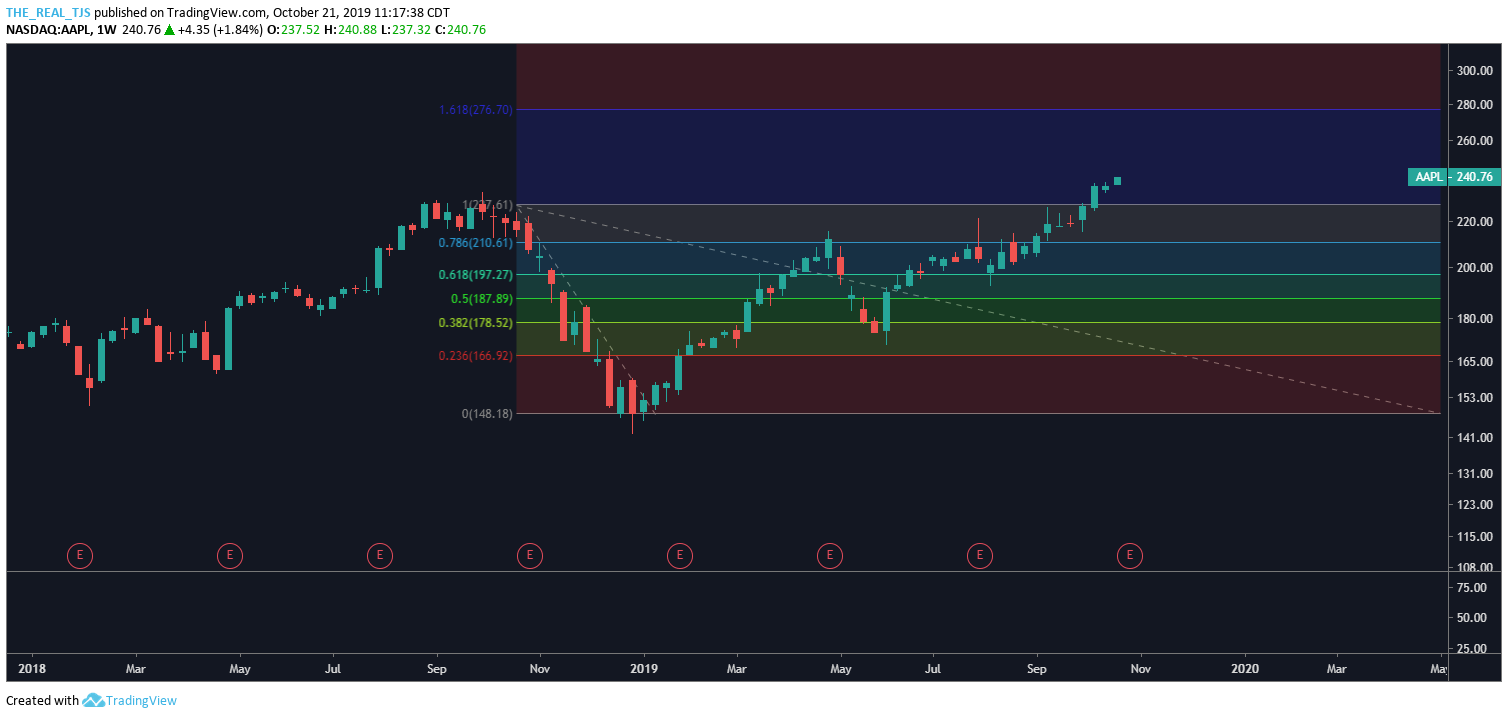
“If we begin with the latest major rally in Apple starting in 2016 and topping in Q4 of 2018, we are nearing an important Fibonacci retracement level and may test this today. I would be comfortable putting the first of my position on near the levels at the 61.8% Fib retracement of the 2016-2018 rally.”
Let’s fast forward to today:
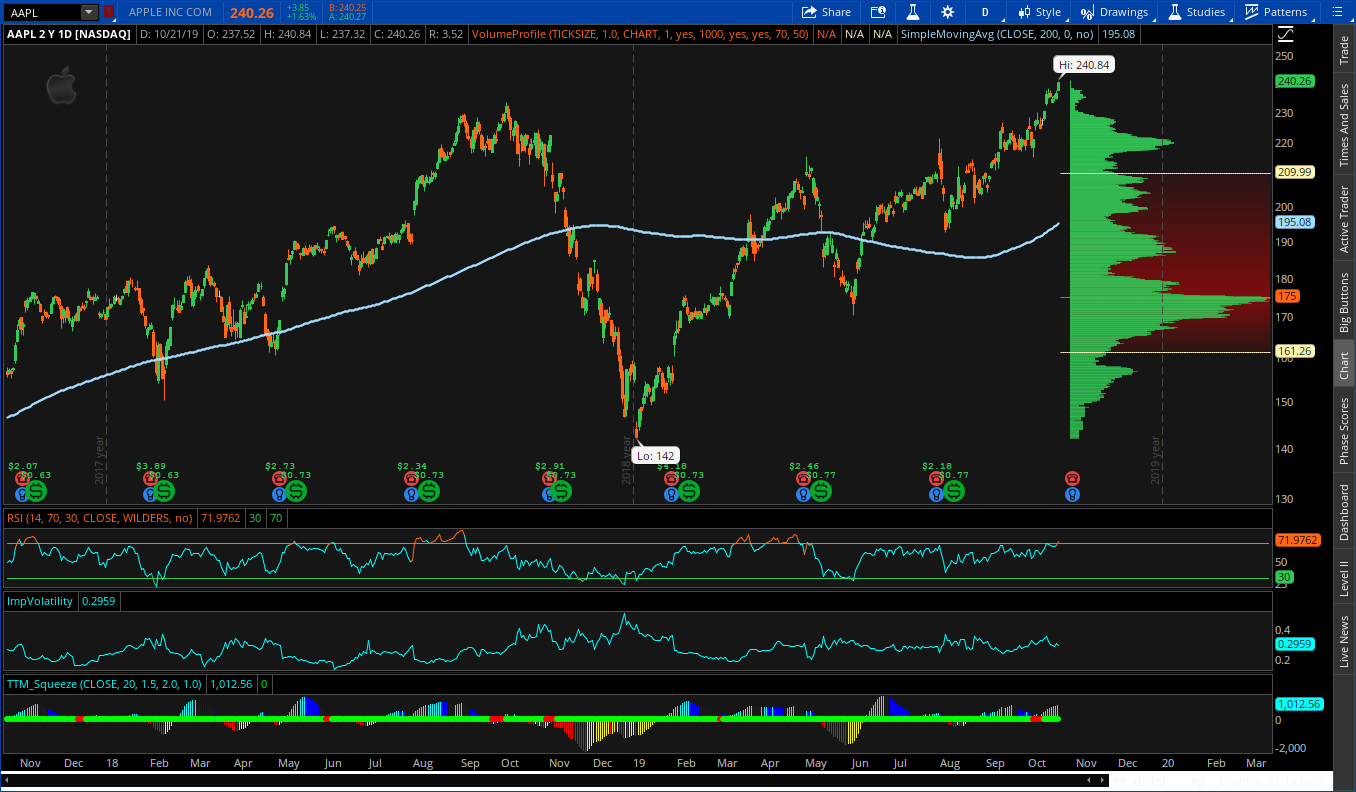
In our industry that is what we call “bottom ticking it.” That is what you want. That is what all this technical jargon is for. That is how you outperform indexes and make a lot of money. There, victory lap achieved.
Now, by the same token, once a stock moves to all time highs, how do you plan for what is to come? In my experience, fundamentals will fall short in trying to predict stock prices, especially in the short term. Technicals are the best bet and since we started this trade using Fibonacci analysis, let’s use just that to get a feel for where price may be headed. At all time highs we use Fibonacci Extensions (or projections) instead of retracements. Price isn’t currently retracing or pulling back, it’s charging higher. In my experience there are several ways to make use of Fib Projections and here is my preferred method:
I use weekly charts and take everything off my chart except price. This cleans things up and makes it easy to see. The other thing I do is start my Fib levels from closing prices, eliminating the long shadows above or below the candles. Then, I use a minimum of at least two of the most recent price dips to get a more accurate price forecast. In Apple’s case we have two very defined price retracements from which to work off of: The first being the minor pullback from this spring and the second being the more major pullback experienced in Q4 of 2018 where Apple fell with the rest of the overall market.
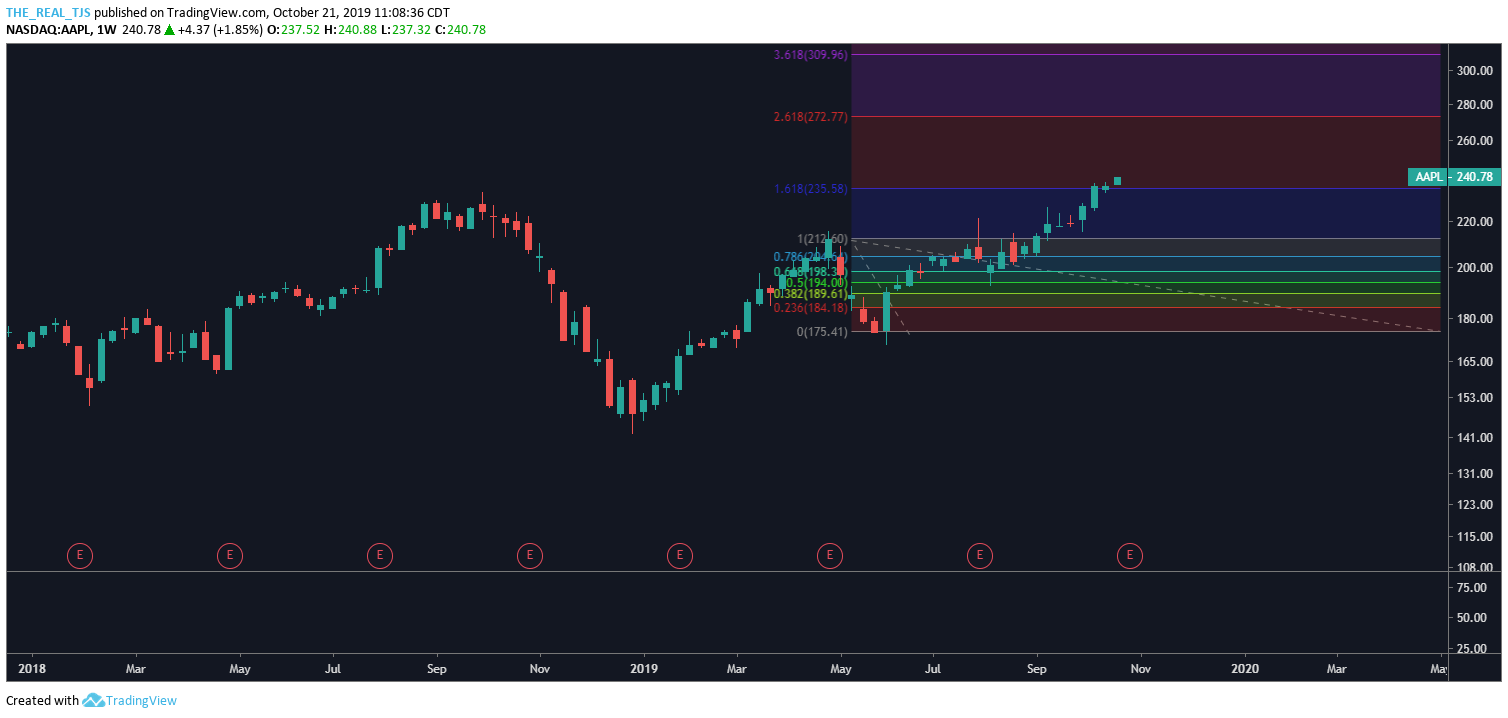
The first major Fib resistance (1.618) shown above has been broken. It served to be no match for Apple’s strong price action and momentum. The next major resistance comes at 2.618 and that would put Apple at about $270 per share or $30 higher than current price. Now let’s do this same analysis using the more major selloff seen at the end of last year:
Taking this deeper price correction into account we can see that the first major resistance (this time the 1.618 extension) is near the $270 price level as well. Funny how that happens… We call this a technical level of confluence and you can be certain that the $270 price level will be a level price will battle with.
In sum, I hope you were able to take advantage of the original post and got in at a good price. From $140-240 is nothing to scoff at – better than a 40% gain. This handedly beats the major indexes and is why we pick stocks. And, I wouldn’t be surprised for Apple to see $270 in the near term.
Happy Monday.
Trent J. Smalley, CMT