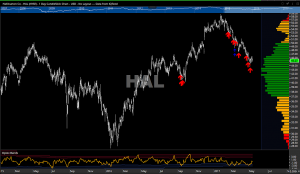
Continuing with my theme from midweek of $XLE and Oil out performance, I believe an opportunity is near in $HAL. While this one is a bit slow for me (beta just above 1.00) I like the name going into the summer.
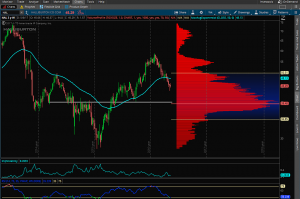
Recently, $HAL has trended lower back towards the neckline of an inverted H&S which coincides with a strong support level as seen by the volume point of control on the weekly chart. This leaves us with a easy line in the sand for risk management. Ideally, I would like to see the stock fall to about $43 before taking a long or adding to a current position.
On a daily chart taking into account just over 2.5 years of data Halliburton recently found a level of possible selling exhaustion, and has begun to trade higher out of it ever so slightly, as seen in the chart below.
For the trade setup, I plan to take the June $45 strike calls for $1.40 looking for a reversal by the close today.
Clear as mud?