
The following is a report I published over the weekend using a tool that I am finding to be powerful and efficient in generating market analysis. The Optuma Publisher allows you to generate research reports and share them to a password protected website, PDF report, email, Power Point, etc. While I am still getting a feel for its operation, it is already saving me time in generating and sending analysis to trade desks and other interested parties.
If you are interested in how Optuma can help you, check out their site here: (Optuma)
Agricultural Complex Week of May 8th 2017
by Trent Smalley | Sunday, May 7, 2017 – 8:17pm
Heading into the week of May 8th I would expect to see Corn to continue its gradual uptrend. Looking at the Cash weekly chart of Corn we have seen two weeks of indecision, as the past two weeks have printed Doji, and near Doji patterns which is when a bar’s open and close are nearly equal. When doji(s) are printed as they have been in Corn the past two weeks, any bullish or bearish vias is based on preceding price action and other confirmation signals. From the Cash chart, we can see an overall uptrend in both price and momentum (The RSI) is uptrending), as well as our confirming MACD Indicator is becoming “less bearish” and looking to make a move up from below to cross the 0 line. One further point is the regression line (While line drawn through price). The regression line is the “line of best fit” drawn through the most recent price action. I would expect that price recapture this regression line mid to late week.
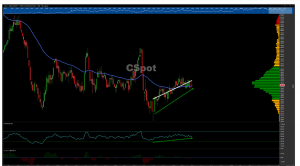
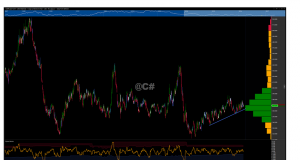
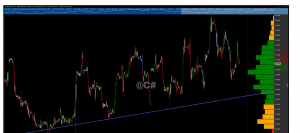
We can see from our Volume At Price indicator on the right side of the 3 charts that Corn is resting at the VPOC (Volume Point of Control) on all time frames taking into account just over 3 years of data. When price is above the VPOC, it is said to be “buyer controlled” and we expect to see a continuation of an uptrend until proven different.
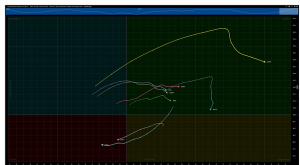
Included also is an RRG (Relative Rotation Graph) in which we have a basket of commodities charted against each other, as well as against a benchmark on a relative basis. The benchmark I used in this chart is the Thompson Reuters CRB Index. At the most basic level, you want to be involved in sectors that are in the upper right quadrant from the long side. Another approach is to allocate into those sectors that are making a move into the upper right “Leading” quadrant from the upper left quadrant.
The majority of the Ag complex has rotated into the top right quadrant (Leading) which means they are outperforming the benchmark CRB Index and they continue to gain momentum and pull further ahead. What, Corn, Soybeans, Bean Meal, Feeder Cattle, and Live Cattle are all outperforming. Crude oil as well as Ethanol have traded from the leading to the lagging (bottom left) quadrant, meaning they are underperforming and continuing to lose momentum relative to the CRB Index as well as the commodities displayed in the Leading Quadrant.
In sum, I think we see Corn continue on its uptrend throughout the coming week. An early week pullback towards the 365 level is possible but should be met with initiative buyers there.
Support Level 1: 365
Support Level 2: 357
Resistance Level 1: 380
Resistance Level 2: 385