
In the business of money management and everything the term encompasses, it really boils down to one simple question: Has the trader, investor, asset manager, etc. generated positive alpha? In finance, alpha is used as a measure of performance. More specifically, positive alpha describes the excess return above and beyond a benchmark such as the S&P 500 Index. You can think of alpha as the excess return you should achieve for actively managing an account as opposed to passively managing one. Generally extra fees will be charged for active management strategies as opposed to passive styles, and if an investor is paying higher fees, he’d better be rewarded via gains in excess of the benchmark index. Otherwise, he could pay next to nothing and invest in an index fund.
Hedge fund managers, mutual fund managers, CTAs, and the like are under immense pressure to achieve positive alpha. If they do they attract client funds, garner the attention of the media and make astronomical sums of money. If they don’t, clients flee taking their capital with them, and redemptions along with a string of years of under performance can cause the funds to close up shop. Positive alpha is the gasoline needed to make the active management motor run. Without the gasoline, the motor will come to a stop, and right quick.
So this begs the question: How does one go about achieving positive alpha? And how does one achieve this excess return above a benchmark on a consistent basis?
The answer to that question has quite literally an unlimited number of examples. For starters, nearly every blog on Omahacharts.com in the past 24 plus months has been a display of its owner (yours truly) trying to achieve positive alpha. I am a market technician by trade, one that employs a quantifiable mathematical approach to it. That is my approach to attempt to beat benchmark indexes on a risk-adjusted basis. Others use fundamental analysis and analyze financial statements of individual companies. Fundamental analysis might be value investing, or it might be trying to project accelerated revenue growth. Further approaches to try and “beat the market” might include:
Quantitative Asset Management
Smart Beta Strategies
High Frequency Trading Strategies
Using Inside Information (Illegal don’t try this one)
And limitless other methods, strategies, and techniques to try and outpace the S&P 500 or other benchmark. All these charts and lines and spreadsheets and hours put in are all in effort to achieve positive alpha. And continue to find it year after year after year.
The following is one method I use in order to try and achieve consistent returns in the equity markets that exceed the benchmark SPX Index…
Within the study of technical analysis is a group of practitioners that analyze financial market cycles and forecast market trends by identifying extremes in investor psychology, highs and lows in prices, and other collective factors. This group is known as Elliott Wave analysts or Ellioticians. The study of Elliott Wave analysis is a massive undertaking. If chart patterns and the study of indicators are your bachelor’s degree in technical analysis, perhaps Gann and Gartley along with Auction Theory are your master’s. Then comes Elliott Wave Theory, that is your PhD and beyond. It’s a niche group and rightfully so. It’s complexities weed out the hobbyist technician and true mastery takes years. I am not a true master at this stage but I have a solid foundation in Elliott Wave Theory that allows me to apply certain principles to help me get in front of moves in stocks that lead to outsized gains. One of these methods is as follows:
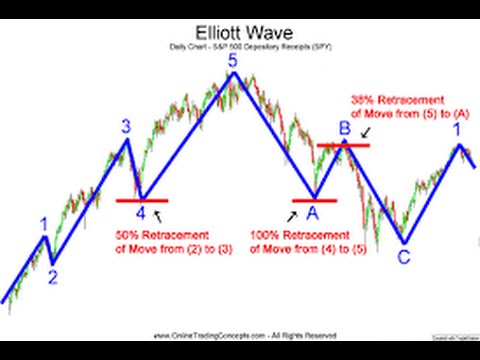
For the purposes of this post, we will focus on the left hand side of the Elliott Wave Map – what is referred to as the Motive Phase or Impulse Sequence (Waves 1-5). For our example we will assume we are in a stock in an uptrend. The map above can be flipped; the 5 wave moves can be to the downside and corrective phases can be to the upside. In Elliott Wave Theory within the 5 wave impulse sequence, one of the waves in the direction of the prevailing trend is “extended.” Meaning in our case, one of the waves, either wave 1, 3 or 5 is longer in price and sometimes time than the other 2. In equity markets, it happens that Wave 3 is most often the extended impulse wave. In commodity markets it turns out that Wave 5 is most often the extended wave. You might notice why this notion of Wave 3 most often being the extended wave is powerful. When we look to get long a stock, we want to get long right before it goes on a major leg higher. If we know that Wave 3 is most often the leg where the stock covers the most ground, it would make sense that we put capital to work towards the end of Wave 2 or the start of Wave 3. To do what? You got it; to capture as much of that positive alpha as possible.
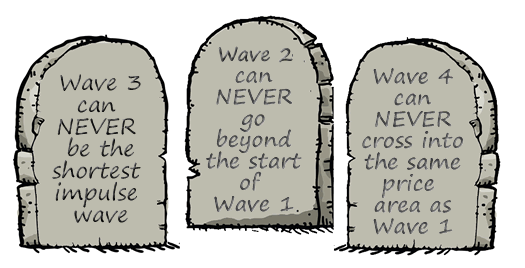
So this begs the question, if we want to try and spot stocks before they embark on their Wave 3 journey to the upside, how do we go about doing that? While difficult, this is not impossible and there are some key points to understand to put yourself in position to find stocks as they are terminating Wave 2 and beginning Wave 3. First we need to understand the 3 cardinal rules of Elliott Wave Theory:
We know from earlier that our goal is to get in a stock before it makes a surge higher in Wave 3, the wave we most often expect to be the extended impulse wave. Since the focus of this particular post is trying to catch stocks as they complete Wave 2 and enter Wave 3, we need to understand as much as we can about Wave 2. Here are the important points complete with an example:
WAVE 2 NEVER RETRACES BEYOND THE START OF WAVE 1
Maybe we think the following chart of $HD stock is a candidate…
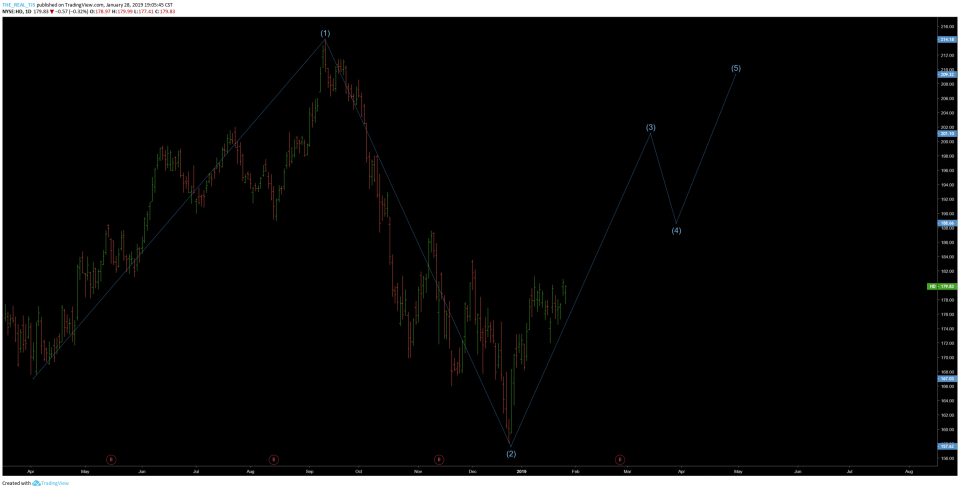
What is the problem? A cardinal rule has been broken. Wave 2 crossed below the start of Wave 1. We immediately know our wave count has been invalidated for HD on this timeframe.
WAVE 2 USUALLY RETRACES A MINIMUM OF 50% OF WAVE 1 BUT NOT MORE THAN 78.6% OF WAVE 1.
Get your Fibonacci tools out, we have some retracements to do. So we now know that we should expect Wave 2 to retrace somewhere between 50 and 78.6% of Wave 1.
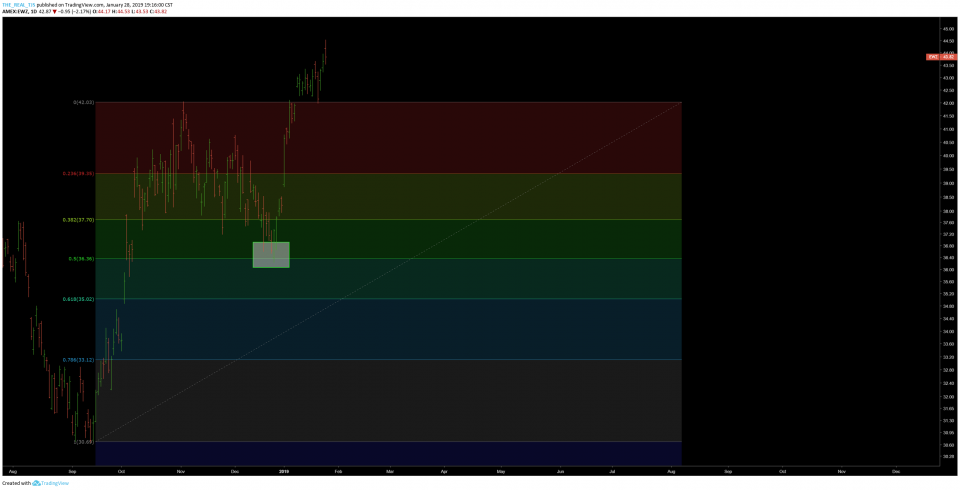
EWZ the Brazil ETF happens to fit the bill, at least from a retracement standpoint. We can see after a strong rally higher, price has retraced just a bit more than 50% of the most recent rally. We will count it. It is more than a 50% retracement and less than 78.6% retracement.
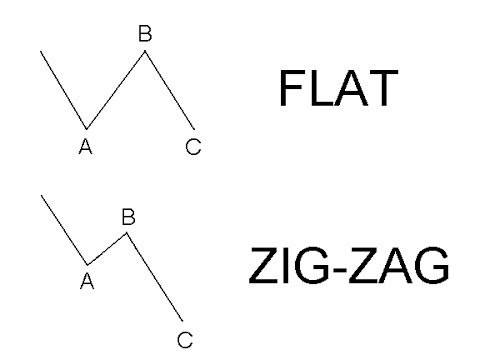
WAVE 2 IS OFTEN A SIMPLE A-B-C CORRECTION
For the sake of simplicity I am not going to go into full detail of Elliott Theory and corrective waves. Suffice as to say Wave 2 often retraces in one of two patterns:
Still think our EWZ example from above passes the test?
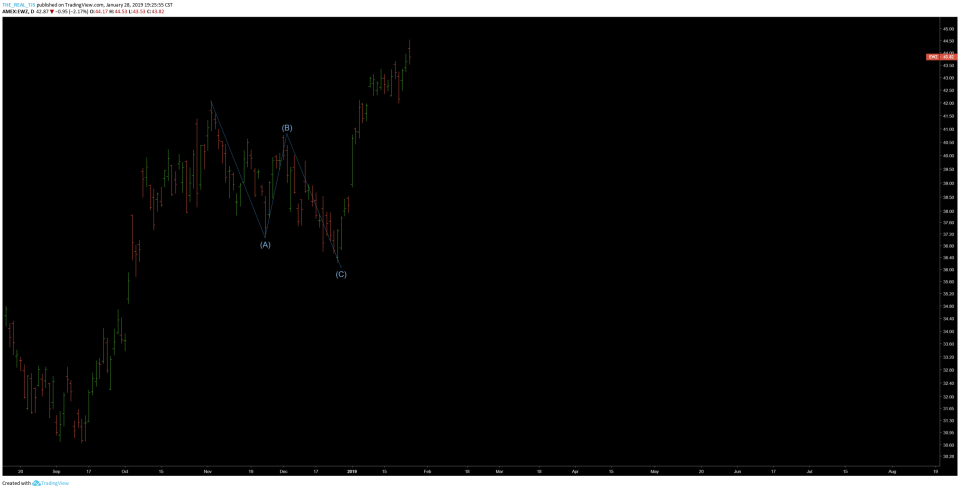
Looks something like a Zig-Zag corrective Wave to me.
And finally, WAVE 2 PERSONALITY CHARACTERISTICS
If you have recently been clobbered by the market, you know the feeling of being hesitant. Maybe you saw an account balance go from $50,000 at its highs to $25,000 during a massive market correction. The pain is fresh in your mind. You decide you need to get back in the game, back to your old winning ways and you get involved in a stock from the long side and catch a nice move to the upside. But sure enough, that move to the upside is met by selling resistance and the stock you are in begins to fall. Still reeling from the losses you recently experienced, you decide you want no part of any more losses and decide to sell your stock for a nice gain. You can be sure that your timidness is echoed by the majority of other market participants, who are not trusting of this initial move (Wave 1) higher. How can you trust this move after what the market did to your account recently? This mass psychology is precisely the reason Wave 2 retraces 50-78.6% of Wave 1. Fool me once shame on you, fool me twice? Shame on me. You can also expect there to be a lot of naysayers and bears laughing in the faces of stock buyers in Wave 2 as well as muted volume. Participants just don’t trust Mr. Market yet.
I am going to let you digest this for now. It is more than enough to try and practice watching for initially. There will be a part 2 of this post soon with a couple of missing pieces that will help you project just how much of a gain you stand to make in Wave 3 and a couple of additional points that will help solidify things.
Any questions @omahacharts on twitter or trent@omahacharts.com
Trent J. Smalley, CMT
This is why omahacharts.com is one of the best financial blogs in the game. Well done sir and can not wait until part 2 is out.