Good morning and welcome to a new week! I’m fortunate in many ways, but one in particular is I have a network of traders whom I get to converse with daily. We talk through overall markets, trade setups, the latest news headlines, etc. Having a network like this is a great idea generation tool and it dawned on me that I should give some of these folks the floor here at Omahacharts as ideas arise. Starting today, you will hear from some of my trading partners from time to time. We can all learn from each others’ different styles and approaches to the market and I want you to have perspectives from multiple traders.
Now for today’s post by my friend Ryan Carr: @RyRy_Carr on Twitter
IRBT is up 68% in a month – is there still money to be made? I can’t tell you anything about the fundamental story here (or anywhere for that matter) other than that Finviz has IRBT listed as a profitable company and with debt/eq reading @ 0. That’s a decent start. Maybe? I’m not sure – I mainly watch price and defer to someone far smarter than me like Trent when I’m curious about a company’s fundamental story.
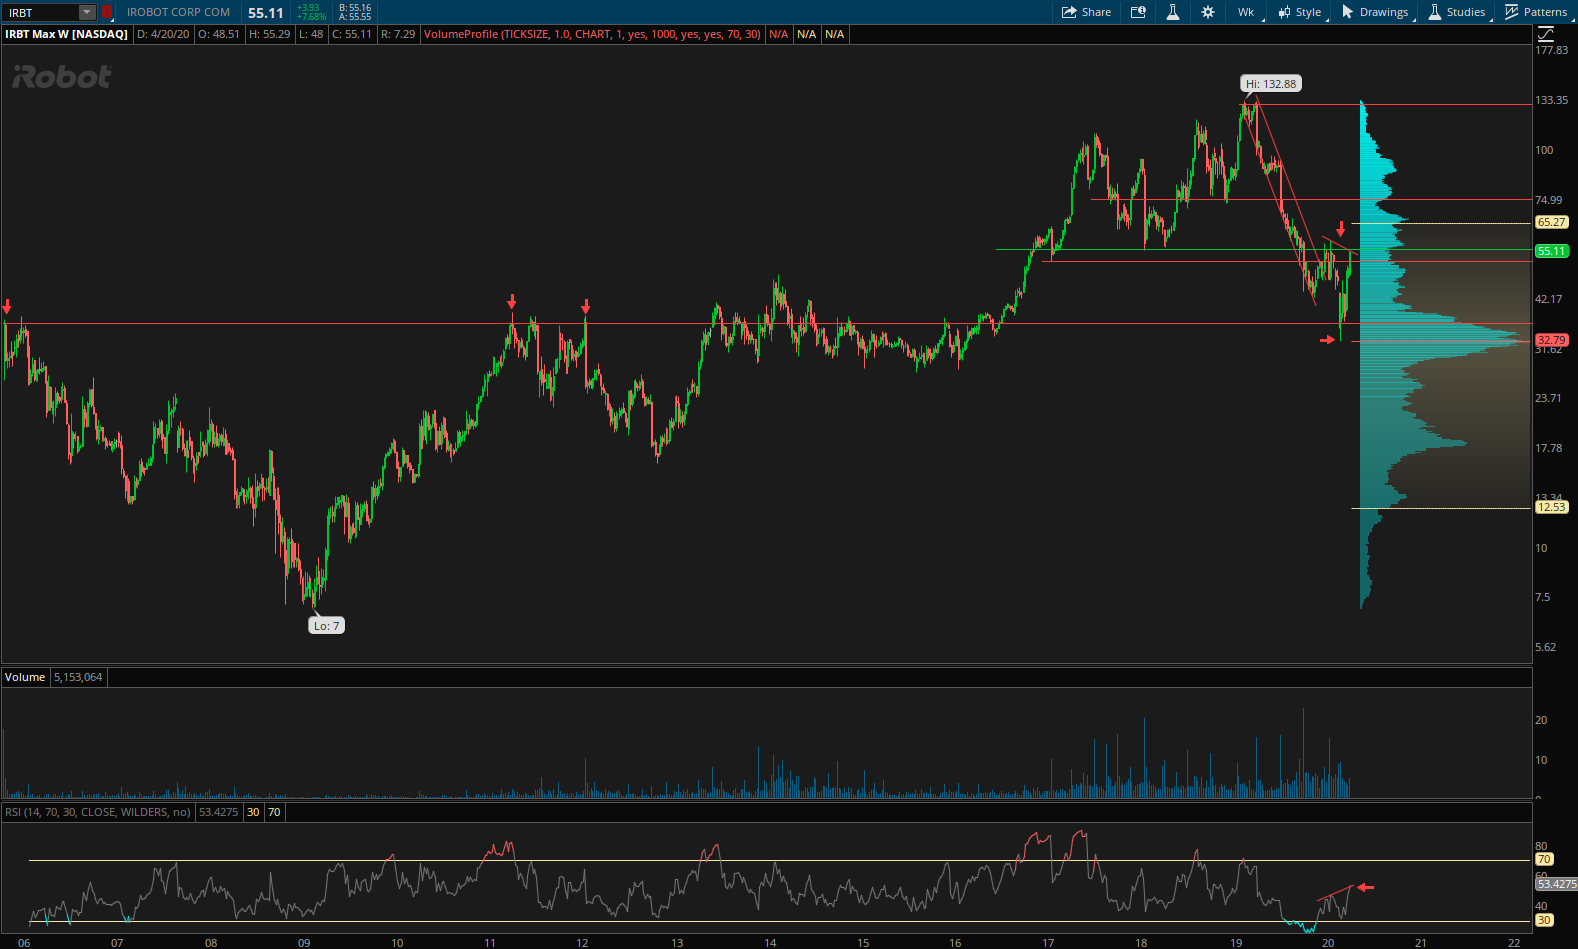
IRBT is a name that I have been watching since late last year and it has again piqued my interest. IRBT closed IPO week in 2006 at $36.51 – This is a level that I will often use as a benchmark, but it has seemed to be an especially meaningful level in IRBT. The weekly chart shows longs testing the level 2 times from 2011-12 and price failing there. From 2013-16, IRBT continued to trade around this level, building out the volume profile before it eventually broke out in late 2016. The stock went on to triple in short order. Since then, IRBT has been volatile enough for those with shorter timeframes to turn decent profits trading it in both directions, but it has been a frustrating ride for investors. 2019 was especially painful as the stock traded from ATHs at 132.88 to a low around $42. IRBT has since broke from the downward channel it traded within throughout 2019 and by early Feb ’20 there was what seemed to be a change in character. The stock looked bound to trade higher.
We all know how markets have traded since then and IRBT was not immune to the rout. What intrigues me most is where it found support. IRBT’s low in 2020 was $32.79 which happens to be the POC for the lifetime volume profile. Since testing that level, IRBT is trading 68% higher and right back into the early 2020 highs that it broke from.
A few additional pieces of information that interest me:
Shortsqueeze.com has IRBT short interest listed at 49% (13.4m shares short on a 27m share float).
Stock price closed over daily 200sma.
A positive divergence on the weekly RSI and social sentiment + mentions are positive.
Options aren’t incredibly liquid but P/C ratio from Friday was .1 (all trades over 35 contracts were calls – 300
May 1 56C traded at $3.5 [spread $3.4/4] & 257 Sept 18 85C traded at $1.7 [spread $1.5/1.8])
Thanks Ryan for the breakdown. This stock is always an interesting earnings trade and not for the faint of heart. Manage risk or don’t trade would be my words of wisdom on this one.
Let’s have a great week!
Trent J. Smalley, CMT