So often lost in the day to day or week to week noise of endless stock market gyrations, is the realization that you may already be in posession of a “multibagger.” In “One Up On Wall Street” the famous investor Peter Lynch coined the term to mean any stock that goes up in excess of 100% above the original investment. For most traders dealing in common equities, multibaggers will be a rare occurance. Let me illustrate.
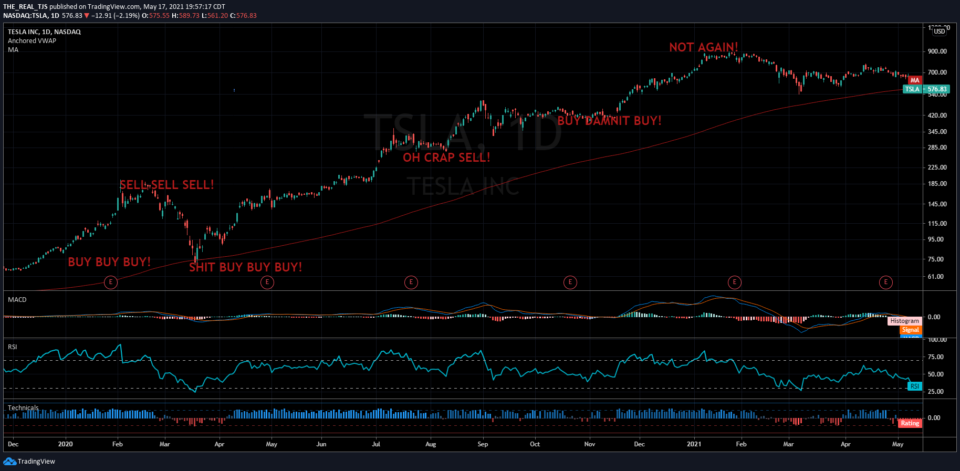
The above is a chart of Tesla throughout year 2020. Had you bought 1 share on the first trading day of 2020, and sold it on the final trading session of 2020, you got yourself a multibagger. The stock traded roughly from $80-$750 in a year. While this is incredibly rare for a stock to appreciate in value at this rate, it does happen. History is rich with examples of individual common stocks generating 1000%, 3000%, even 10,000% returns over time. Johnny Trader staring at his 15 min charts would have been in and out, back in and back out, back in, and all the while he’s losing his sanity, his CPA, (and his hair) stressing over day to day moves, the investor with a steady hand clobbered his maniacal need for action.
In the game of long term investing to build wealth, it is my belief that investors should allocate at least a portion of their overall portfolio to areas of the market more likely to generate above average rates of return. This of course varies based on risk appetite, investor time horizon, and overall portfolio objectives, but having at least a small percentage of your money allocated to those areas most likely to deliver “multibaggers” can make sense. It only takes one or two of these abnormal returns to make a big difference in the long term. One Tesla, or Monster Energy position will move the needle enough for your overall portfolio to make the search worth it.
So where does one begin the search for one of these outliers? A short discussion on ROIC can help us narrow down which segments of the market are perhaps more likely to contain some big future winners.
Return on invested capital (ROIC) in its simplest form, is a measure of profitability of a company and their propensity to create value relative to capital invested by debt and equity holders. This metric and a discussion thereof gets fairly lengthy, so if you want to read more about it there is a link just below to a presentation done by Wharton Finance going more in depth.
http://finance.wharton.upenn.edu
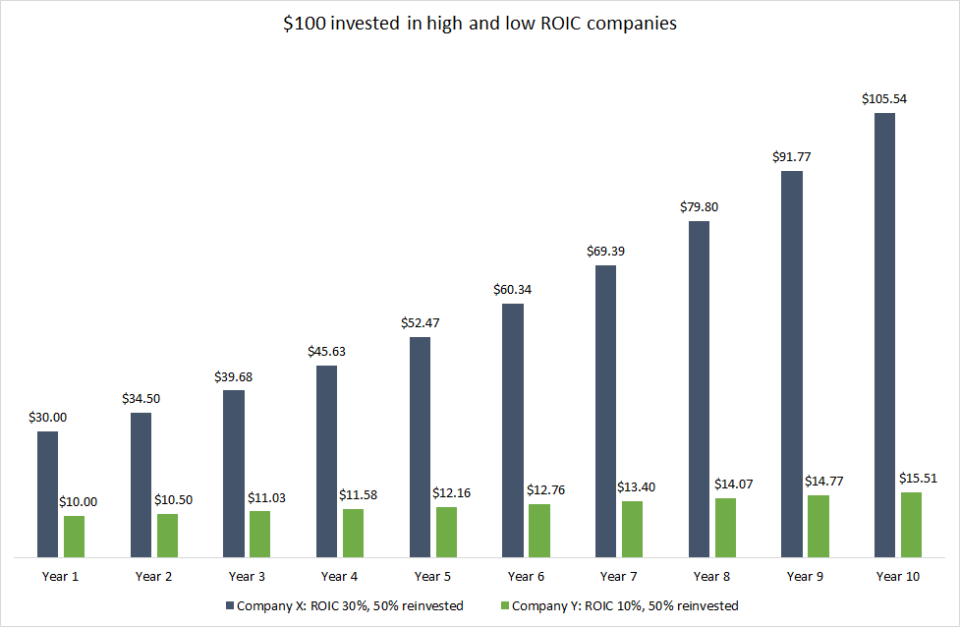
If you don’t feel like reading more about ROIC (I don’t blame you), a graphic by Robbe Delaet at Seekingalpha will suffice for now. The following assumes $100 invested in high and low ROIC companies.
Obviously it is to our advantage to find areas of the market exhibiting above average ROIC, and especially those areas which have consistent or even increasing returns on invested capital. McKinsey & Company in their book “Valuation; Measuring and Managing the Value of Companies” ranked industry segments of the U.S. market based on ROIC going back to 1995.
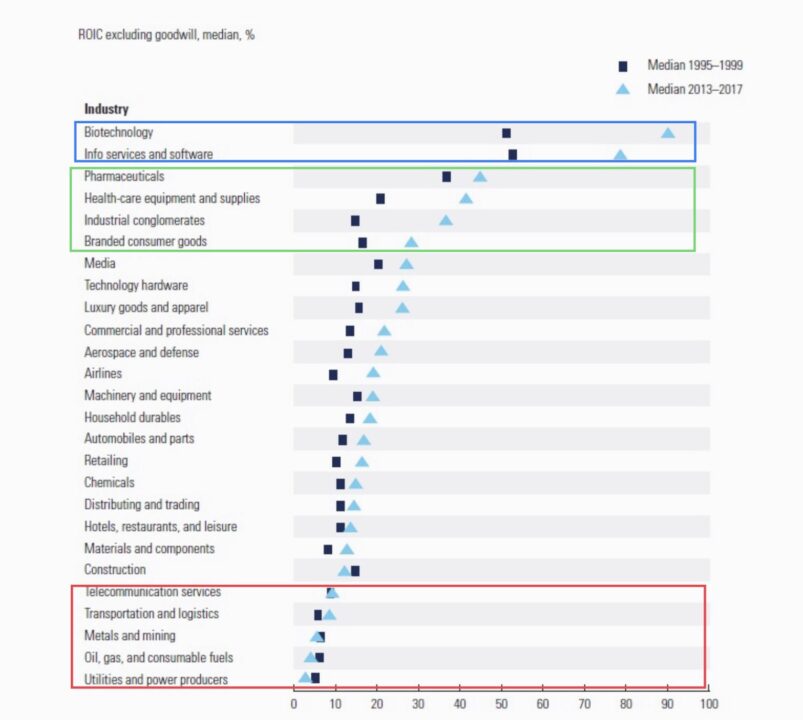
While there will always be exceptions, we can see from the above graphic areas more likely to generate above average returns over the long term. There is a reason the majority of my long term portfolio is spread across technology, biotechnology, health care and medical devices, and media and advertising. There is also a reason I don’t own one individual utility stock, or metal and mining company. I may trade them from time to time, but my long term holdings are spead across those market groups most likely to generate above average long term wealth.
It is no secret that there will be significant variability between individual companies in these top performing industry groups, and that is where the in depth understanding of the companies’ competivite advantages, brand loyalty, pricing power, patents, and sustainable barriers come into play. Individual companies should be benchmarked against comparable ones operating in similar or adjacent industries, and that is homework that should be done quarterly. At least this gets you started, and might deter you from selling some of your high powered long term winners to circle into the theme of the day.
Trent J. Smalley, CMT
Please remember that past performance may not be indicative of future results. Different types of
investments involve varying degrees of risk, and there can be no assurance that the future performance
of any specific investment, investment strategy, or product made reference to directly or indirectly in this
newsletter (article), will be profitable, equal any corresponding indicated historical performance level(s),
or be suitable for your portfolio. Due to various factors, including changing market conditions, the content
may no longer be reflective of current opinions or positions. Moreover, you should not assume that any
discussion or information contained in this newsletter (article) serves as the receipt of, or as a substitute
for, personalized investment advice from JSPM LLC. To the extent that a reader has any
questions regarding the applicability of any specific issue discussed above to his/her individual situation,
he/she is encouraged to consult with the professional advisor of his/her choosing. A copy of our current
written disclosure statement discussing our advisory services and fees is available for review upon review.