
In the spirit of full transparency, what one of my heroes Ray Dalio would call “radical transparency,” I’d like to show you what it looks like to be dead wrong.
I posted this seemingly perfect chart a few weeks back of $MNK:
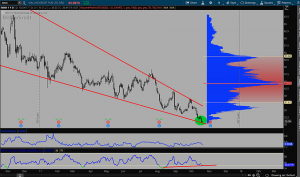
Falling wedge pattern, tripped the low, bounced back exactly where it should. I would take this trade 10/10 times. Here is where we stand today:
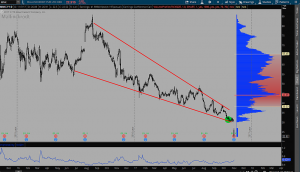
Down close to 30%. Not good fam. While this is a long term position for me, I am uncertain as to what to do. If we see no reprieve in the coming day or two I will likely have to cut it.
I’ll do better next time.
OC