The wisdom of implied volatilities
Options are remarkable products that very few people truly understand. The less sophisticated players in fact oftentimes regard them as little more than directional bets on the market. From the professional trader’s standpoint they are anything but that. Option traders regard options through a single loop, that of implied volatility.
So let’s clarify first the concept of volatility. There are two types of volatility: realized – or historical – and expected – or implied. Historical volatility is in fact a measure of standard deviation – or dispersion / variability – of daily returns over a specific period of time which is then annualized. It results directly from the closing prices of the instruments (stocks , indices) underlying the option contracts. Implied volatility is in essence a market forecast regarding future historical volatility. It results from reverse engineering by looking up option prices and is thus the result of 1. supply and demand of certain options for certain strikes and, more importantly, 2. of the biases of professional option traders.
Option traders normally maintain a so-called spot neutral position and whatever option position they end up with because somebody is buying or selling them options is being hedged through an offestting cash trade. It can be mathematically demonstrated that delta hedging on short option positions can only yield losses; in a volatile market such losses are magnified. It can also be mathematically demonstrated that option time decay across volatility and maturities is non-linear. For these two reasons professional option traders have a massive interest to correctly price implied volatility. If they go too low they will end up selling too many options and hedging them can yield staggering losses. If they go too high they will pay up too much premium which will end up being eroded by the sheer passage of time. It’s a tough balance to keep.
What you must retain from this conversation is options markets tend to be remarkably accurate predictors of significant market moves. There are many tricks I could show but I guess the more significant ones pertain to tail risk and implied volatility spreads.
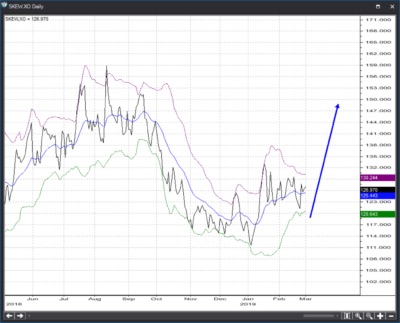
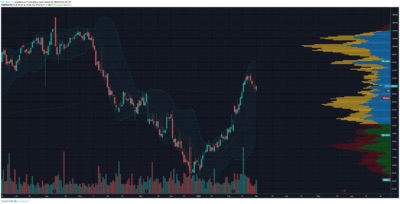
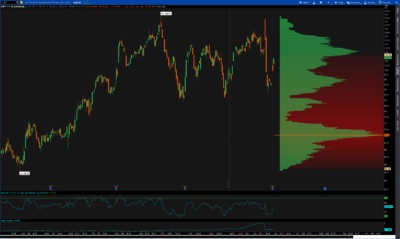
With tail risk the concept is easy. The higher a market goes over a period of time and the more skewed a distribution of daily returns gets towards positive numbers, the more likely a mean reversion pullback becomes. The lower a market crashes and the more skewed a distribution of daily returns gets towards negative numbers, the more likely a mean reversion bounce becomes. The risk of extreme market moves of course can be inferred from the level of implied volatility of short-dated far out-of-the-money options. The CBOE has developed a so-called SKEW Index that measures just that. Readings of 150 and beyond in the index signal approaching shake-ups. Readings of 100 and below signal exhaustion of the bearish energy and an approaching bounce. The SKEW index right now is compressing but perhaps this will resolve with a little pullback before a move higher. This is perfectly compatible with the S&P 500 filling in a bit after a failed test of 2820-2840 before perhaps climbing higher yet in the 2nd part of the year. I would focus on the first part of that projection over the next month or so.
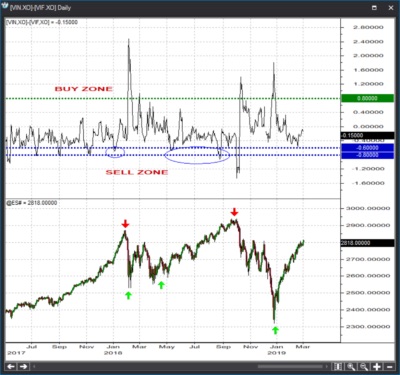
Likewise the volatility spreads currently signal a little bit of complacency. Near-term VIX is the implied volatility that results from shorter-dated options; far-term VIX is the implied volatility that results from longer-dated options. Generally S&P 500 lows develop with the VXN / VXF spread reaching an extreme high and S&P 500 highs develop with the spread reaching an extreme low. The spread has crossed recently below 0 so it has officially entered “market hit” territory. This is very compatible with the SKEW and the pattern in the S&P 500 itself. Both charts shown above just SCREAM “pullback overdue”.
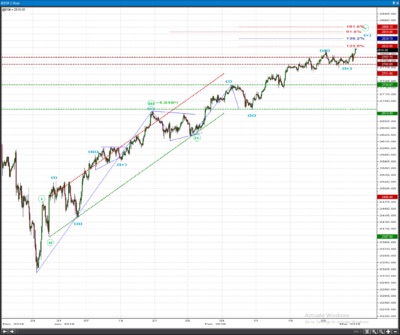
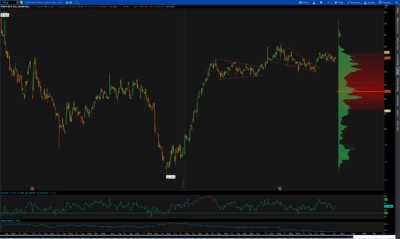
The near-term SPX count is updated below. The immediate uptrend is defended at 2783-2798. We’re counting on 2823 / 2840 / 2855 to stall the advance. A minimum downside target of 2675 and quite possibly 2625 is envisioned for the pullback but we will discuss downside objectives once a top can be confirmed. As it was the case in the previous 2 or 3 weeks I think we can only pencil one in tentatively this week again but can’t confirm it just yet…….
STOCK PICKS
PLUS
| DIRECTION | BUY ZONE | SELL ZONE | RISK/REWARD | VEHICLE |
| LONG | 88.50-90 | 95-96 | -1/5 | OPTIONS |
A member of the familiar application software industry group, PLUS is wedging lower right into the 200 day SMA. This is a simple continuation pattern that should resolve higher. With the 200 day acting as support immediately beneath, we have a defined level to use as a frame of reference. I like this for a quick 5-6 point move higher in the next couple of weeks.
ICPT
| DIRECTION | SELL ZONE | BUY ZONE | RISK/REWARD | VEHICLE |
| SHORT | 108-110 | 98-97 | -2/10 | OPTIONS |
ICPT gapped higher late last week which I believe will be a short lived win for the bulls in the near term. Back on Feb 19, 20, and 21 the stock was sold off on massive volume and it will take a monumental effort to take prices back toward those highs. We can use the value area high at the mid 108s as a spot to start getting short via puts. Biotech stocks are quite often highly volatile so prepare for fast moves here.
PENN
| DIRECTION | BUY ZONE | SELL ZONE | RISK/REWARD | VEHICLE |
| LONG | 24.75-25 | 29-30 | -.50/4.00 | OPTIONS |
After a parabolic start to 2019, PENN has been in a consistent pattern of wedge, pop, wedge, pop, wedge pop. This price action occurring above the yearly point of control with a recent bullish initiative candle on the daily gives us a solid floor of support. This won’t be as fast as a biotech stock but April calls should provide for an advantageous risk/reward.
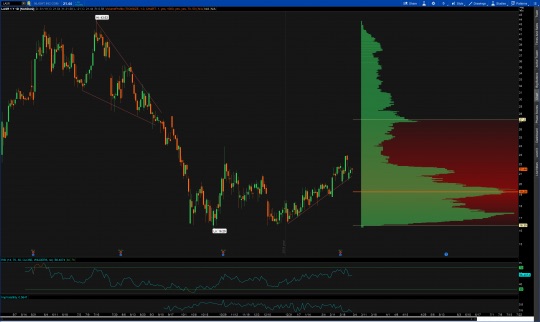
LASR
| DIRECTION | BUY ZONE | SELL ZONE | RISK/REWARD | VEHICLE |
| LONG | 21-21.50 | 26.75-27 | -.50/6.00 | OPTIONS |
A relatively recent IPO, LASR is a semiconductor stock that is following a defined uptrend higher in 2019. Simplicity is powerful here in that a break of the 2019 trendline is an obvious level should we need to exit the trade. This is an example of follow the trend until proven wrong. With earnings behind it, IV should be on the low end this week and I will look to April calls to capitalize.
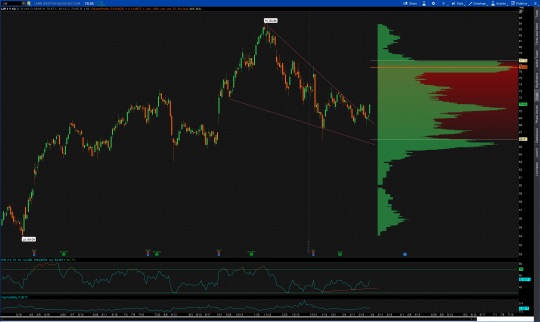
LW
| DIRECTION | BUY ZONE | SELL ZONE | RISK/REWARD | VEHICLE |
| LONG | 70-71 | 76.75-77 | -1/7.00 | OPTIONS |
Nearly making last week’s list is LW, primed and ready to bounce higher this week. I’ve had my eye on the bullish falling wedge pattern here for a couple of weeks and was waiting for the retest of the breakout and confirmation of such. We seemed to have gotten that on Friday so we should have the all clear for a move up to the one year VPOC.