[vc_row el_id=”Commentary”][vc_column][vc_column_text]
Growth stocks will not do better than value stocks for much longer.
Since we’ve started our letter a couple of months ago, we took ample time to discuss in this long-term commentary section how various pockets of the market are aligning for some kind of market top. The analysis would be incomplete without looking at relative trends of performance between growth vs value stocks. With the market having done what it’s done this past week, it may be decent timing to understand the market from that angle.
Everybody should understand why growth is generally favored during the advancing phases of a bull market while value is favored during corrections and of course during bear markets. The whole rotation between growth and value is perhaps the best aggregate reflection of investor risk appetite, even more so than plays between selected growth vs defensive sectors. The growth vs value relative strength line indicates willingness and ability to make risky bets across the broader market rather than just specific pockets of it.
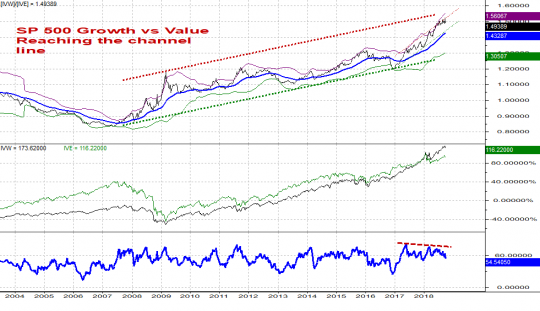
The chart above is a weekly chart of the relative strength line obtained by dividing the S&P 500 growth ETF (IVW) and the S&P 500 value ETF (IVE). After being in a downtrend for a full eight (8) years between 2000-2008, the ratio bottomed in early 2008. It has trended higher ever since. In the past, corrections in this ratio have generally been preceded – and if you will, in some sense, announced – by combinations of i. bearish momentum divergences and ii. at least 2 and sometimes 3-4 pokes higher above the +2 STDEVs line taken from a 55 week moving average. The divergence we see at the moment is at least 6-7 months old and since the beginning of the year we have registered 2-3 pushes above the +2STDEV line and subsequent reversals. In addition, the ratio is running into channel line resistance at multiple degrees of trend and the rendez-vous with such points would typically lead to some sort of reaction. Conditions are definitely ripe for the mid-term uptrend in the Growth / Value ratio to at least take a break here.
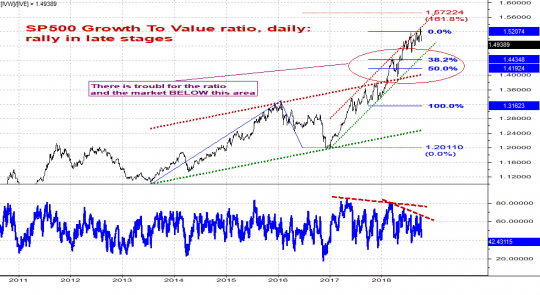
If you look up a daily chart of that same ratio you will discover something even more interesting. While the Growth / Value ratio remained pointed higher in the past 12-15 months, a tendency to decelerate is clearly visible (lower RSI highs on every new higher price high). The same thing happened prior to the 2016 correction. In essence, the proximity of the 1.52-1.57 resistance range, the attainment of the short-term channel resistance line and the momentum condition we see on the daily chart are worrisome technical ingredients at the moment. Not only does this ratio appear vulnerable in the weekly time frame, it also appears prone for a reversal in the daily time frame. Quite frankly, a push below 1.42-1.44 would probably spell trouble for the prospects of growth vis-à-vis value stocks and, if history is any model, for the market as a whole………..[/vc_column_text][/vc_column][/vc_row][vc_row el_id=”PATTERN ANALYSIS”][vc_column][vc_column_text]
Pattern Analysis
Published with data through OCT 5th
S&P 500 Large Caps
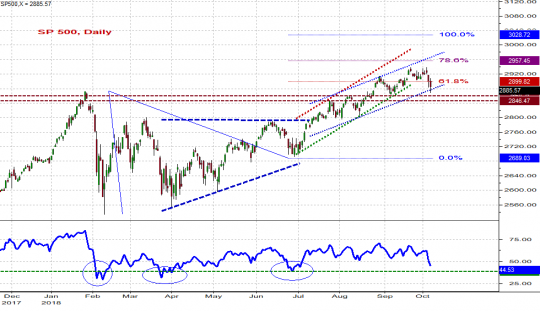
For the touch and feel it had, the past week has not really achieved the destruction we’d expect: the RSI is just above readings seen at earlier lows in the year, structural support around 2850 has yet to give way and prices are still somewhat confined to an uptrend channel. If prices are to form a near-term low – perhaps as the USDollar seems to be forming a corresponding near-term peak, thus helping the case for a bounce in large caps – they should establish one now and from above 2845-55 they should rally quickly above 2920. A continuing decline below 2845 will announce a heavier retreat towards 2800 and then 2750 / 2689.
S&P 400 Mid Caps
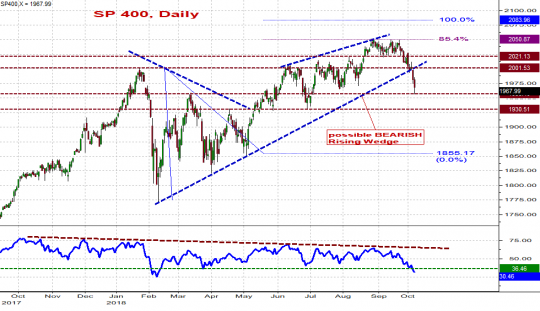
The mid caps saw more serious damage this week as their rising wedge pattern may be breaking down here. A continuation of the current slide below 1960 / 1930 would clarify that the terminal move out this year’s triangle pattern is completed and prices were already retracing towards 1855 / 1825 / 1800. Alternatively, pushing back up above the 2001 / 2021 zones would mitigate the immediate downside risk although at this point the midcaps have deteriorated enough for us to question the value of any attempt to go long. At least until the USDollar is completing its short-term pullback, it may be wise to stay away from mid and small caps altogether……..
S&P 600 Small Caps
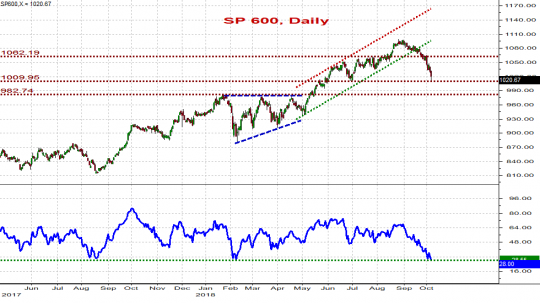
Very similarly, the small caps are struggling here. Continuing lower below 1010 / 983 would constitute further aggravation after the past 2-3 weeks of dismal performance, and; even if we recovered back towards / above 1062 we wouldn’t achieve much more than a mitigation of the immediate downside risk at this point. We’d stay away from this space at least until we see a strong short-term low is forming in the USDollar.
Dow Industrials
Dow has held even better than the S&P 500 this week. What we said last week still stands:
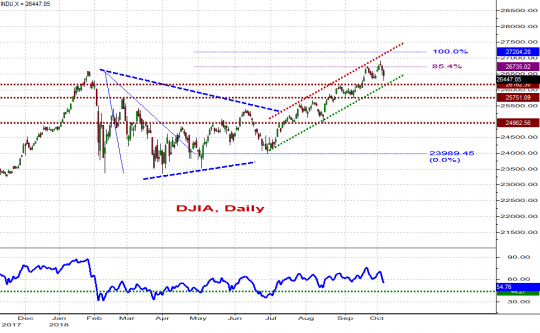
REPEAT ::::: We will maintain a cautiously positive outlook here too and say that a final rally within the 26753 – 27217 range will remain due if and only if prices remain above the 26156 / 25751 progressively more critical supports. Below those areas the Dow Industrials will get exposed to a deeper pullback towards 24,900 and then 23,900.
Nasdaq 100
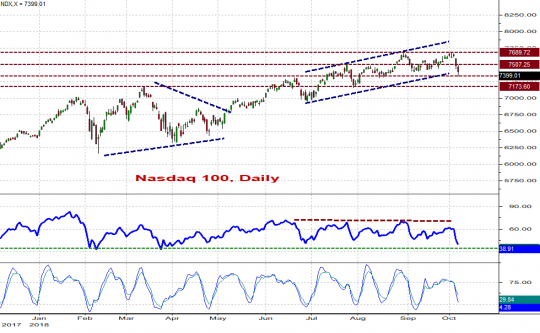
The Nasdaq 100 has yet to see a significant crackdown in the larger uptrend. Prices ought to push below 7310 / 7170 to confirm a larger decline towards 6800 / 6500 and ultimately 6000-6200 area; or they will inevitably bounce back to challenge resistance at 7507 / 7690 and then 7724 / 7851.
Published with data through OCT 8th
Dow Transportation
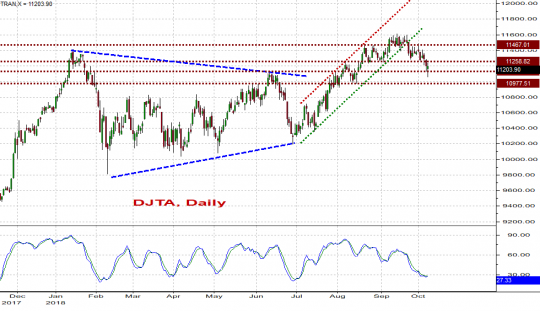
The tranies poked through a key level intraday today but closed back above it. Prices seem oversold and the market is attempting to hang in here so we’ll say this: we’d like the 10977 / 11156 supports to continue to hold and we’d like prices back above 11258 as an initial sign that a recovery towards 11467 / 11600 was underway. Further weakness below 11156 / 10977 would be likely to extend lower towards 10800 and then 10650 / 10400 / 10200.
Dow Utilities
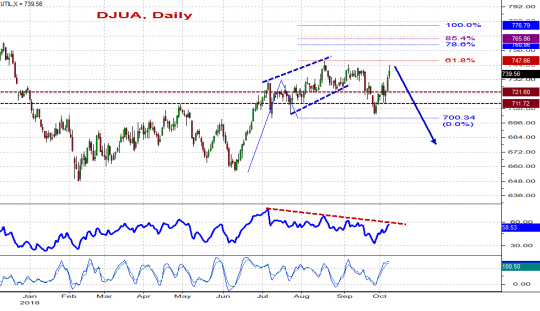
The push down last week was false alarm and got quickly reversed. Still, formidable resistance remains located at 748 / 761-766 and we expect the Utilities, before long, to run into a significant amount of trouble. Near-term support is now located at 722-730 and then 703 – 712 and has the exact same pivotal role we previously assigned it.
Russell 1000
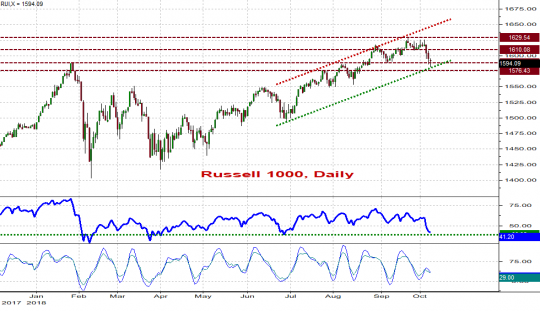
Not unlike the S&P 500, the Russell 1000 is hanging in here. Further pushes below the 1576 / 1552 key supports would open the door to a larger slide towards 1500 and then 1450 and as such would be cause for concern. As it stands now, however, the pattern and the momentum condition of RUI remain rather conducive to the formation of a near-term low as the initial building block for a return towards 1610 / 1629.
Russell 2000
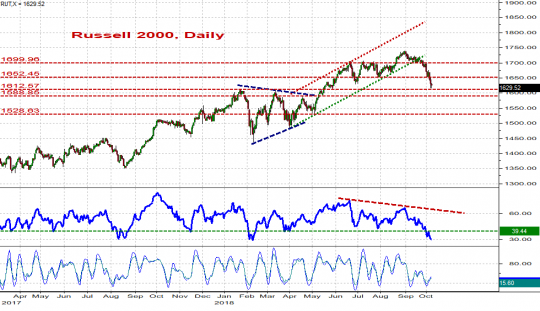
The small cap space, as we said, is the real dog here. The RUT may stabilize for a little while and rebound to take a look at the 1653-1665 and then 1699 resistances; but overall the slide to date is heavy enough for us to conclude that a push below 1588-1613 is almost a given – perhaps as part of a larger corrective retreat towards 1528 and then 1500 / 1450.
 Nasdaq Composite
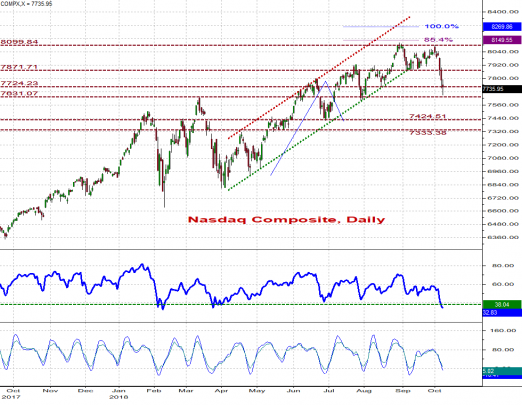
The Nasdaq Composite is at a similar key juncture here: further weakness below 7631 would open the door to an immediate decline towards 7425 / 7333 ahead of 7200 and then 6960. But the available technical evidence suggests we may want to give the COMPX the benefit of the doubt here – at least for a few days – as it sits right on key support and may attempt to form a low to return at the 7872 and then 8100 resistances.
[/vc_column_text][/vc_column][/vc_row][vc_row el_id=”STOCK PICKS”][vc_column][vc_column_text]
Weekly stock picks
MGM
| DIRECTION | BUY ZONE | SELL ZONE | RISK/REWARD | VEHICLE |
| UP | 26-26.75 | 30.75-31 | -.25/+4.50 | OPTIONS |
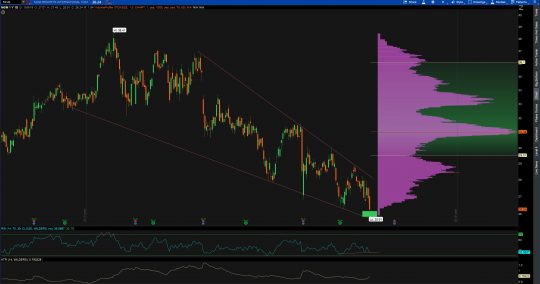
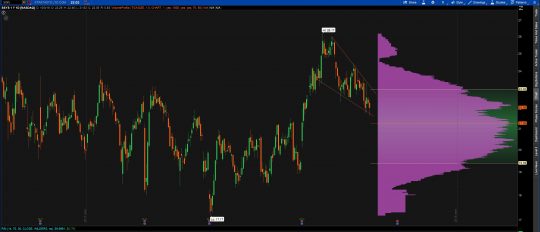
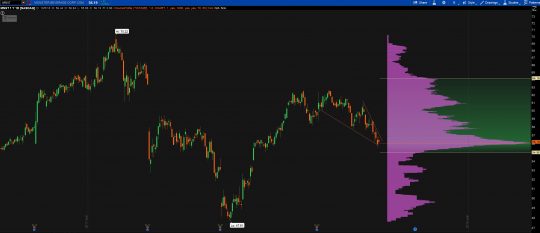
MGM is putting the finishing touches on a falling wedge pattern that began forming early this year. Leaving a lower shadow Friday (as many stocks did) right at the lower bound of the pattern. Pair that with an ever so slight bullish momentum divergence and you have a well-defined opportunity for a long right from these levels. Play for a breakout up to the HVN (high volume node) near $31. November options will be the play keeping in mind earnings are in November.
MNST
| DIRECTION | BUY ZONE | SELL ZONE | RISK/REWARD | VEHICLE |
| UP | 56-56.25 | 61+ | -.25/+4.50 | OPTIONS |
MNST as of late has put in a small wedge pattern right into the VPOC on the one year daily chart. This serves as the major support level from which we want to be on the long side of the trade. A bigger inverse head and shoulders has formed in MNST this year furthering our argument for a level to get long. You can get long MNST right here, right now via options but waiting too long will make the premium cost prohibitive as implied volatility begins to creep up with earnings next month. The November 55 and 60 strike calls would be the two plays I will be looking at coming into this week.
IMMU
| DIRECTION | BUY ZONE | SELL ZONE | RISK/REWARD | VEHICLE |
| UP | 19-20 | 24.50-27 | -1/+5.00 | OPTIONS |
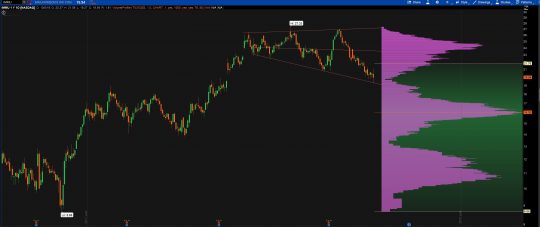
IMMU has found its way back onto the U.S. Equity Top list this week. It has continued to play within the bounds of this broadening formation, trading down to the lower end of the range. This is optimal level to take a long in these patterns, playing for a move back to the midpoint of the range and beyond. The prices immediately below invalidating our long thesis we want to get long right here and now. I will be looking to play this month’s October Options at the $20 strike level Monday for a quick trade.
AAPL
| DIRECTION | BUY ZONE | SELL ZONE | RISK/REWARD | VEHICLE |
| UP | 220-225 | 233+ | -4/+9 | OPTIONS |
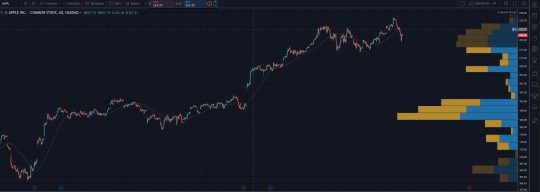
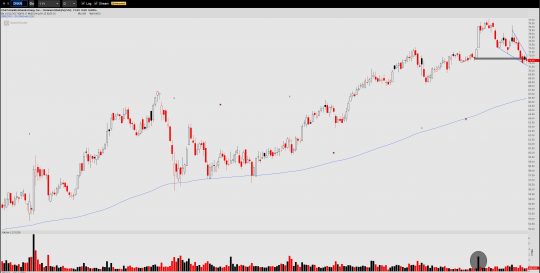
Since early September, AAPL has carved out a cup and handle type formation which is seemingly near the end of the handle. Bulls defended lower on Friday as the stock put in a long lower shadow on the daily chart. Assuming we get a bounce back in the NASDAQ, AAPL is primed to have a strong week and a weekly option play would be my choice here back towards the $230 level.
DNKN
| DIRECTION | BUY ZONE | SELL ZONE | RISK/REWARD | VEHICLE |
| UP | 71-71.50 | 77-78 | -.30/+7 | OPTIONS |
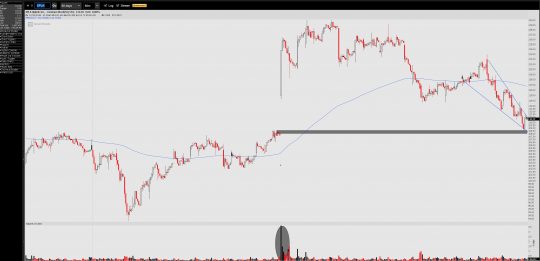
DNKN is near the apex of its falling wedge pattern that is coming into an area with a prior high volume gap up. Often times we see these levels defended and that gives us a couple of reasons to take a quick long trade in this name. Earnings are being reported October 28th so make sure to play accordingly. I am inclined to trade the regular October expiry calls here looking for a run up into earnings as well as an increase in implied volatility.
ZTO
| DIRECTION | BUY ZONE | SELL ZONE | RISK/REWARD | VEHICLE |
| UP | 15.50-16 | 19-20 | -.10/+4 | OPTIONS |
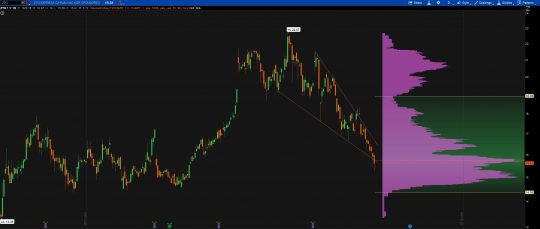
ZTO has the quintessential falling wedge pattern which pushed lower directly into the one year VPOC level. Leaving a long lower shadow right where it needed to, buyers showed late day strength on Friday as the defended lower. The stock is ripe for a long right here and now, and I will be shopping November call positions early in the week.
SSYS
| DIRECTION | BUY ZONE | SELL ZONE | RISK/REWARD | VEHICLE |
| UP | 21.25-22 | 26-26.50 | -1/+4 | OPTIONS |
An abbreviated version of the ZTO chart, we have SSYS. We have prices which ramped up in August coming back in and flagging lower back into support. While price is completing the apex of the wedge, I wouldn’t be surprised to see one more sweep lower into the 21.50 area or VPOC for the daily one year chart. Set an alert for prices under 21.50 and you have optimal entry. I think it is safe to take a long from these levels provided you are prepared to take a bit of heat on the trade in the early going.
SPLK
| DIRECTION | BUY ZONE | SELL ZONE | RISK/REWARD | VEHICLE |
| UP | 108-110 | 118-119 | -2.50/8.00 | OPTIONS |
Much like DNKN from this week’s list, SPLK is near the apex of its falling wedge pattern that is coming into an area with a prior high volume gap up. Often times we see these levels defended and that gives us a couple of reasons to take a quick long trade in this name. I like this back to the $118 level at beyond and November options off the open Monday.
ADBE
| DIRECTION | BUY ZONE | SELL ZONE | RISK/REWARD | VEHICLE |
| UP | 260-263 | 283-285 | -3/+20 | OPTIONS |
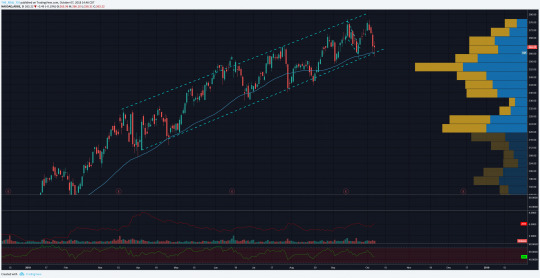
ADBE has been trading in an uptrend, respecting a channel pattern that is well defined. As price has fallen into the support level of the channel that coincides with the 50 day moving average, we want to get long and play for a move back to the resistance level at the channel’s top. The daily candle left a long lower shadow on Friday and I think this reverses higher early in the week.
HOME
| DIRECTION | BUY ZONE | SELL ZONE | RISK/REWARD | VEHICLE |
| UP | 28.70-30 | 36-36.50 | -.50/+7.0 | OPTIONS |
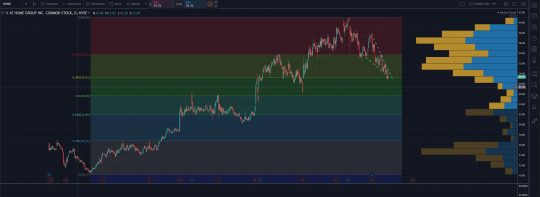
HOME is wedging lower and coming into the 38.2 Fibonacci Retracement from the primary uptrend that began at the end of 2016. Price actually broke down, falling outside of the wedge but price twice was defended at the 28.70 level. I think this could be a fake a move to make a move situation and would play for a break back upwards toward the 36 level.
[/vc_column_text][/vc_column][/vc_row]

