EMPLOYING “ALTERNATION” TO DECIPHER PROBABLE WAVE STRUCTURES
One of the most important concepts / guidelines under the Wave Principle is that of “alternation”. Alternation basically suggests that within a specific Elliott Wave sequence of a certain degree you will not get two things happening sequentially twice in a row. Alternation has many faces and many subtleties that, as with everything else related to the Wave Principle, take time to fully master. But I think timing is right to explain what alternation is about, in particular because most of the decisions regarding the options we face in the stock market in the weeks and months ahead will be understood largely within the framework provided by the guideline of alternation.
So what is “alternation”. Well simply put the guideline of alternation says that once the market does something in a particular position in an Elliott Wave structure, it will tend to do something complimentary in a “cousin” or similar position. The best example is probably the wave 2 vs wave 4 alternation. If a wave 2 correction, for instance, is of a flat family pattern – such as a flat, triangle or double or triple three – wave 4 will tend to be of the sharp family patterns – such as a simple, double or triple zig-zag; and vice-versa if wave 2 is “sharp”, wave 4 will be “flat / sideways”. Sometimes alternation happens within the same family of patterns but apart from one particular combination / pair of patterns that is rather rarely the case. Oftentimes, wave 2 can end up being a flat and wave 4 can end up being a triangle or a complex correction in which case obviously both corrective patterns, while qualitatively different, belong to the same family of patterns. In addition, on just a few occasions I’ve seen wave 2 developing as one kind of zig-zag and wave 4 being a different kind of zig-zag. Most often, however, we will get corrective pattern family alternation between wave 2 and wave 4 structures. Similar principles apply to B vs A waves in corrective processes and to the internal legs of a triangle pattern.
Showing a few examples will help but first let us clarify what pattern families are. The two major pattern groups are IMPULSIVE / TREND DEFINING and CORRECTIVE / COUNTERTREND. Inside the corrective group we have the sharp family patterns and the flat family patterns. The sharp family patterns are easy to understand: they are 5-3-5 structures which sometimes are repeated twice or three times to give us simple, double and triple zig-zags respectively. The flat family patterns are more complicated but generally fall into the flat, triangle and combinations categories. The cardinal rules are: flats subdivide as 3-3-5, triangles subdivide as 3-3-3-3-3 and combinations cannot have more than one zig-zag and the triangle can only appear in certain positions. Long story short: there are 3 patterns of the sharp family and 3 patterns plus different variations of the flat family we are to encounter. It may seem confusing but believe me it is amazingly useful information because at times you will understand what is possible and at others, even more importantly, you will understand what is NOT possible – or at least less probable. The current juncture is interesting because it has elements of both.
So let’s see what our current structure look like:
The correction of April – September 2011 in the S&P 500 unfolded in a straight line, retraced 78.6% of the previous June 2010 – April 2011 rally on a print basis and about 61.8% on a closing basis. It is an ideal candidate for a wave 2 pullback.
The correction of 2015-2016 unfolded as a more limited, sideways affair. It looks like a 3-3-5 flat pattern, it has retraced about 23.6% of the previous September 2011 – May 2015 advance and it has bottomed right within the price territory of the previous (October 2014) correction low. It is thus a solid candidate for a wave 4 pullback.
This means that the entire June 2010 – October 2018 advance is a likely a big 3rd wave, making the current pullback a correspondingly large degree 4th wave. According to the guideline of alternation this structure simply MUST alternate in form with the tiny wave 2 down we’ve traced between April – June 2010.
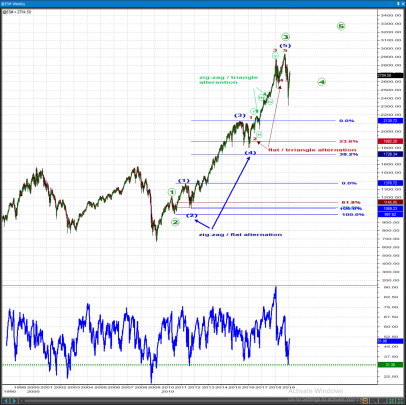
We already know that the move from the October 2018 highs is a rather violent double zig-zag down which contrasts with that tiny 2010 structure that was in fact a simple zig-zag pattern. Bulls will contend enough alternation is present to bet on the resumption of the larger trend. I disagree. Just look what happened inside wave (5) from 2016 of primary 3 from 2011. At one lower degree of trend we had flat wave 2 vs triangle wave 4 alternation. At two degrees lower we had zig-zag wave 2 versus running triangle wave 4 alternation. I am practically convinced that the December low was not the entire primary wave 4 and that we must fry more bulls and bears alike in a time-consuming trading range before the larger uptrend makes it to new highs one last time. There are obviously alternative scenarios but with the information we have right now they are the lower probability event.
In remaining adamant that a greater display of alternation is necessary before we call for the end of this primary wave 4, I must explain to you why I insist we remain patient. First of all, you must understand where alternation stems from. Human nature is such that we tend to learn form the MOST RECENT experiences and that is generally why we won’t do the same thing twice in a row as individuals or as communities and societies – the proverbial guy who gets burnt eating hot soup tends to blow, as they say in Romania, even in the yogourt. But there is a more important point to make. With alternation or without the immediate trend is up. The alternation idea is treated as the ace in the sleeve to correctly anchor our expectations during this rally so we avoid ending up with the most extreme position at the worst possible time which as it stands now would be on an eventual approach of the October highs. Because whatever happens next, chances are the pullback we’re seeing right now is something that should be used as an opportunity to go long. We are facing I think three possible scenarios:
- The December 2018 was the bottom of wave (A) of a sideways flat or triangle primary 4 (circled). Underway right now would be wave (B) of 4 (circled) that would seek to approach the October highs. Inside wave (B) wave A was terminated near 2740, wave B is now in progress and should bottom somewhere within the 2450-2550 range over the next 2-5 weeks. Wave C of (B) up would then get underway towards 2820-2850. Expect the market and fundamental conditions to be worse at the wave B of (B) bottom than at the end of the December sell-off. This assumes wave (B) up will trace out a simple zig-zag pattern whose form will alternate with the double zig-zag pattern of wave (A) down;
- Similarly, all things at point 1. stay the same but wave (B) ends up being a flat or a complex pattern. We could retrace as much as 78.6% to 85.4 to 100% of wave A of (B) and then charge higher in a sharp, powerful and likely news-driven impulsive C up. This is totally conceivable given the abundance of news and events we can easily project based on the current global economic and geopolitical situation. Brexit, the shit show in the US Congress, Venezuela are all items that can steer in all directions from one trading day to the other and while they will bring nothing new to the market’s overall pattern, they can bring a lot of volatility. Option 2 here would be the roller coaster.
- The December 2018 low was the bottom of the entire primary wave 4 (circled). The V reversal ever since is wave (1) of 5 (circled) up, with the current pullback likely representing wave (2) down within wave 5 (circled) up – and thus presenting the best buying opportunity in the next little while. Lack of alternation between the primary waves 2 (circled) and 4 (circled) make this the lower probability event.
The daily chart diagrams below explains the approximate ranges for a wave B of (B) bottom under all these scenarios.
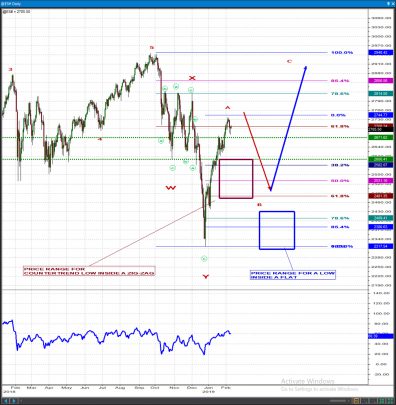
Bottom line:::: we’re expecting a little earthquake shortly but overall, as this initial leg up from the December lows is being retraced, we are likely to be presented the best buying opportunity for 2019. If fibo and structural supports near 2300-2400-2500 don’t hold, we will be forced to revise but as it stands now there is a good chance the market is pushing down against a slingshot and will get catapulted significantly higher as the primary wave 4 (circled) correction from the October highs continues to progress. In the near-term, pushes below 2640-2670 confirm that the entire leg up from the December low is being retraced. Because there was no momentum divergence at the 2740 high we cannot rule out wave A of (B) is still in progress though a number of other studies we follow suggest that is not the case.
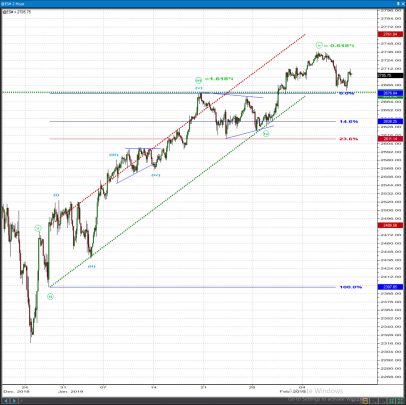
P.S. Subscriber TB asked for a near-term count for the SPX. There are too many textbook elements to list here, if anybody needs clarifications let’s jump on a call or something. Based on our calculation wave A is over……
 OmahaCharts Technical Stock Analysis – US Stocks Service Weekly Letter Volume 5-2019[/vc_column_text][/vc_column][/vc_row][vc_row][vc_column][vc_column_text]
WEEKLY PICKS
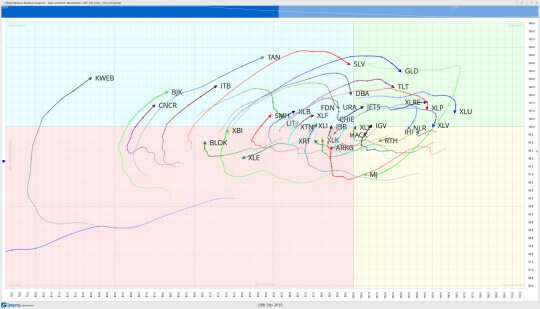
I had mentioned last week that we should prepare for a pullback, or at minimum a small rejection of levels that were showing to be a confluence of overhead supply. Here is what I saw as well as how that move had played out thus far:
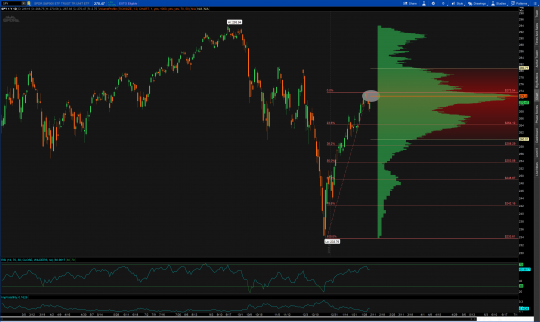
ETN
| DIRECTION | SELL ZONE | TARGET | RISK/REWARD | VEHICLE |
| SHORT | 76-77 | 72-73 | -1/4 | OPTIONS |
ETN rejected off of the 1 year daily VPOC which happened to also coincide with a rejection of its 200 day simple moving average. I like it as a short for a move back to the lower value area bound over the next couple of weeks.
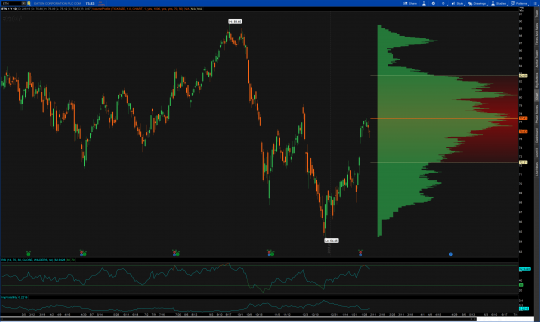
SQ
| DIRECTION | BUY ZONE | SELL ZONE | RISK/REWARD | VEHICLE |
| LONG | 71-72 | 79-80 | -2/6 | OPTIONS |
After breaking out of its primary downtrend and falling wedge pattern recently, SQ has begun to coil up around the VPOC once again which I ultimately think will break out to the upside. A move back toward $80 is the target and with VPOC just below this becomes an easy trade to manage as we know if we are wrong quickly.
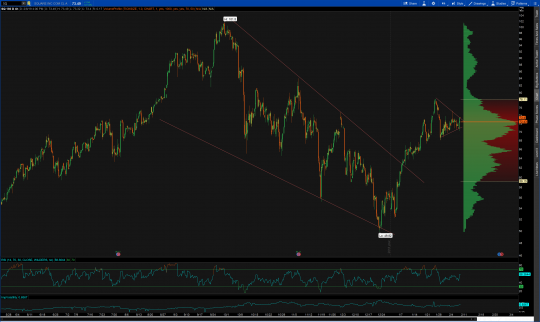
SCVL
| DIRECTION | BUY ZONE | SELL ZONE | RISK/REWARD | VEHICLE |
| LONG | 35-36 | 40-41 | -.50/5 | OPTIONS |
SCVL is a new name to the OmahaCharts Elite Member watchlist. Not a true falling wedge pattern, but may exhibit price action as such poses an interesting trade this week. Price is coming into an area of volume support, lower support on the daily Bollinger bands and the 200 day simple moving average. The name also sports 10% short interest which leaves room for a squeeze to the upside.
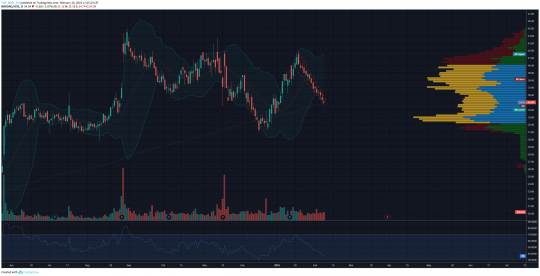
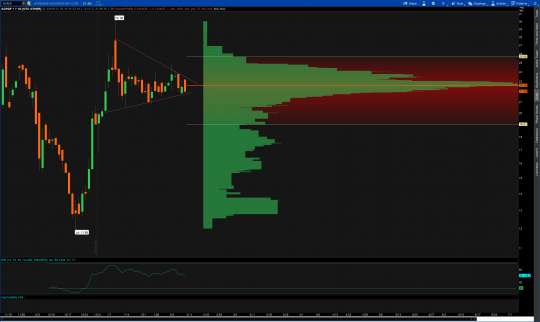
ACRGF
| DIRECTION | BUY ZONE | SELL ZONE | RISK/REWARD | VEHICLE |
| LONG | 22.50-23 | 30-31 | -.50/8 | STOCK |
A new cannabis IPO in late 2018 is forming a bullish pennant pattern right around VPOC on the daily. While we don’t have much price history to work with in new issues, the cannabis names have been strong thus far in 2019 and more upside is to come as each of these names take their turn trading higher. This stock was pointed out to me by a friend whose relative is part owner. I haven’t dug into the financials, simply a trade based on price pattern.
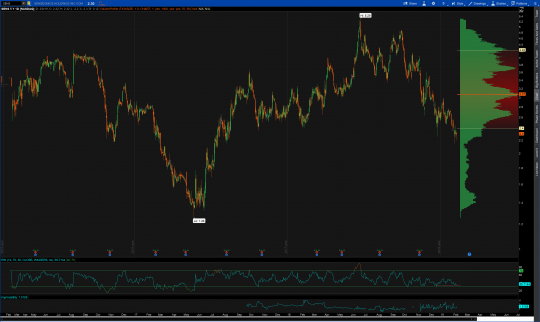
SENS
| DIRECTION | BUY ZONE | SELL ZONE | RISK/REWARD | VEHICLE |
| LONG | 2.15-2.20 | 3-3.10 | -.15/.70 | STOCK |
One of the strongest industry groups in the past few weeks has been the medical device group. While trying to find a name in that group which had pull back I ran across this this small company which offers a good risk reward opportunity. Treat this like an option with no theta and manage position size accordingly. Price has wedged to the lower bound of the value area taking into account 5 years of price history. I like this for a bounce back towards $3.00 in the coming weeks.
 [/vc_column_text][/vc_column][/vc_row]

Thanks Marius for the count. I appreciate it