The Subban hit coming …………..
Hockey is an awesome sport. It’s fast, it’s spectacular, it’s entertaining and it’s fun. Canada has a tremendous tradition with it and so does Russia, Finland and Sweden but in the past 3-4 decades the US made enormous progress and became a hockey powerhouse too. The NHL – not the Olympics – is where you look for the highest level of professional hockey in the world.
Perhaps the most loved and supported – and at time booed – franchise in the NHL is the Montreal Canadiens. When my family and I used to live in Montreal the buzz was so big that my then 8 years old son inevitably got the sting – and right now he is in the 10th season of playing himself. The youngster I’ll never forget coming into the league for the poise and dedication he was playing with in his first NHL seasons was P.K. Subban. His hit on Boston’s Marchand will transcend seasons and generations of players for a long time to come: I want you to look it up here https://www.youtube.com/watch?v=5YG9Na5F9eg.
When watching the stock market these days I have the feeling we’re looking up that Mrachand-hit-the-unexpected-Subban-wall collision. Marchand retrieved the puck in the MTL half and cycled all the way behind his own net with it; so did the stock market properly cycle in a small degree correction earlier this year remaining in clear bull-market territory. Marchand did a couple of tricks crossing the half ice mark and avoided initial trouble as he was approaching the MTL zone; so did the market avoid all the negatives as it was pushing to new highs in September. And then all of a sudden a Subban picking speed on backwards crossovers erected a human wall in front of Marchand out of nowhere; much like the market got hit hard out of the blue in October. A rattled Marchand then goes to the bench while Subban – which had applied a stiff but perfectly clean and legal hit – ended up drawing Boston penalties from Marchand’s frustrated team mates; much like it looks the short-term bear will inflict further damage on those that stubbornly refuse to accept that a decline into 2200-2400 is currently the higher probability event.
US Stocks Service Weekly Letter – Volume 17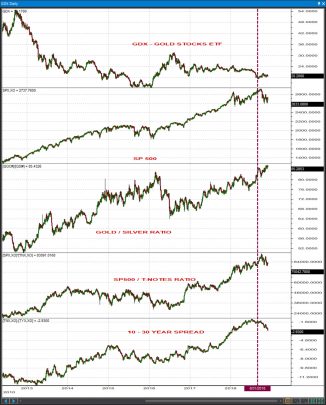
The chart above explains why it’s premature to buy dips. Gold stocks turned up in late August. The market then ran into trouble in late September. The gold / silver ratio – which as we said trends opposite to precious metals – topped a month later, concurrent with the SPX / T-Note ratio. The 10-30 Yr spread had at that point peaked two months earlier. This is just an impeccable reflection of a roll-over process towards defensiveness. Given so many fuses that can go off – Brexit, geopolitics, trade wars – it’d be foolish to ignore these developments.
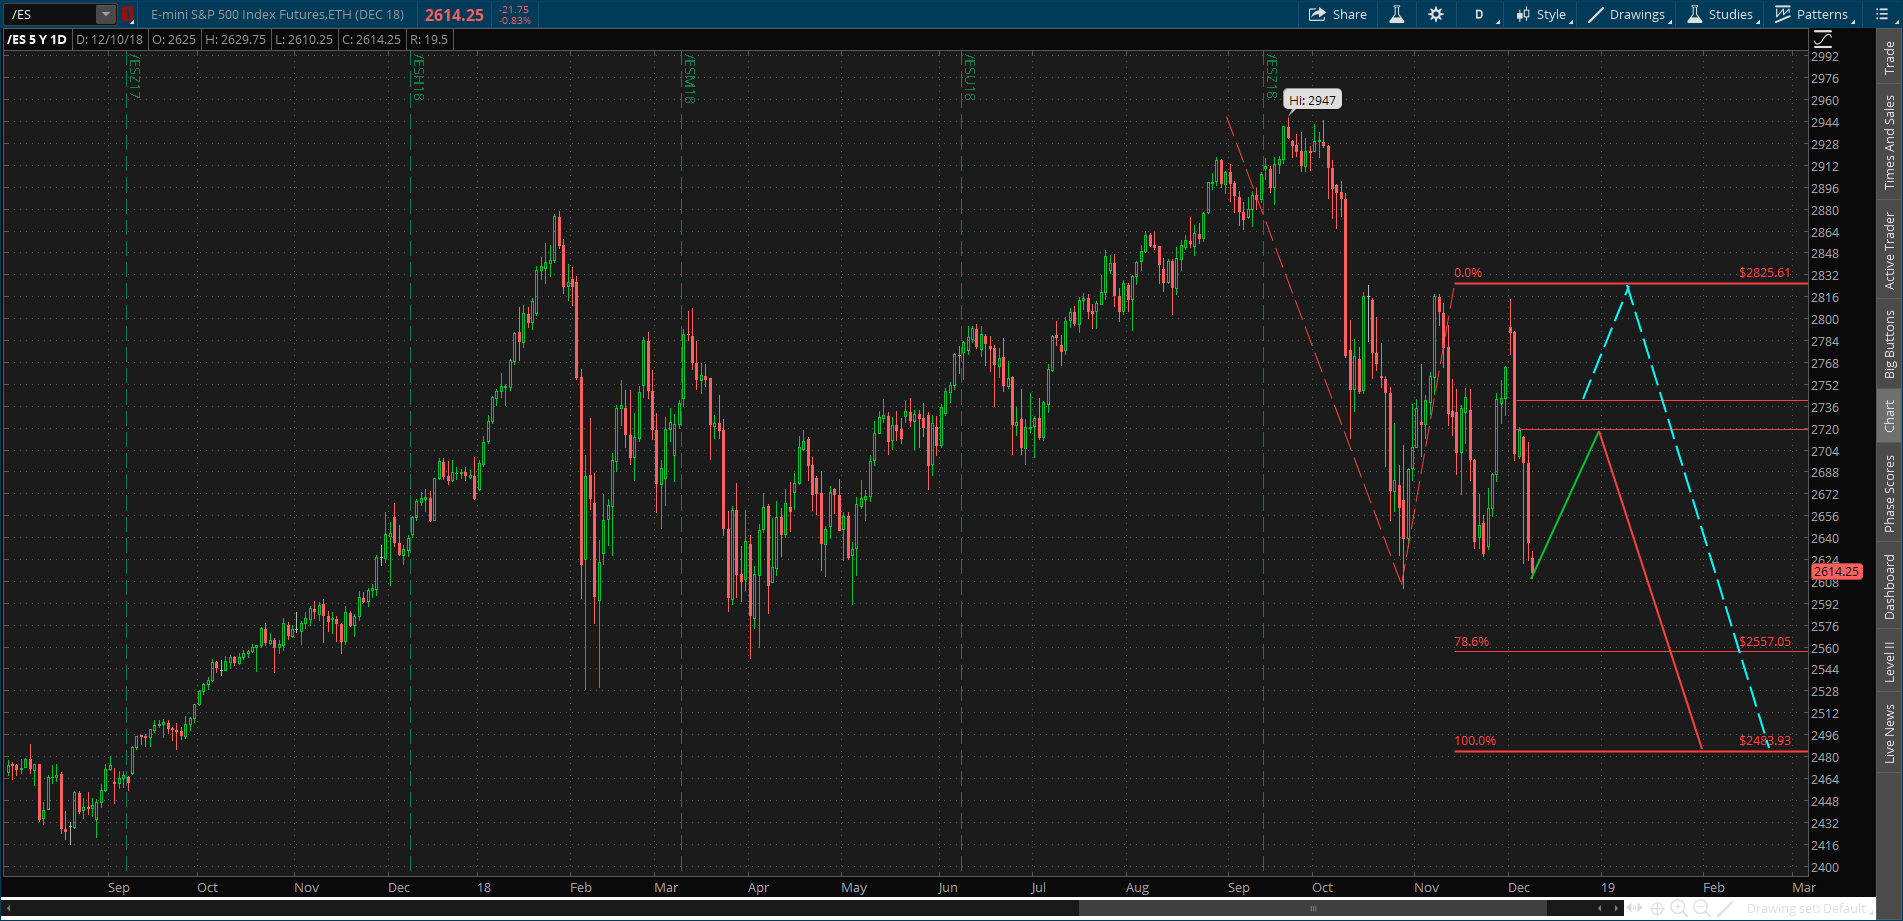
I’d be far more detailed in my analysis tonight if this piece was not typed with my broken and casted hand. But I will just say this: do work with the case that unless the 2820 area is overcome in the SPX a thrust lower towards 2200-2400 is the next important thing to happen. The proximity of the 2600 support area suggests we may get a bounce early in the week but if we fail before, around or not far from 2820 the interesting part of a Subban-like hit is actually yet to come. Have a look also at the DAX and the FTSE100 and you will understand quickly how the mess in Europe is far from over. Also look up a Deutsche bank chart – the only thing worse in history is the South Sea bubble crash and the collapse during the Tulip mania. Germany’s / euroZone’s largest bank is accelerating lower after consolidating for years in the aftermath of a 90% decline. The market maybe telling us that a 73 trillion Euros derivative junkyard may be losing it and you just have to wonder, how is that not compatible with rising precious metals, falling yields and correcting stocks? While the US clearly has its own problems, the irony of the current situation is that the potential for a financial storm seems to be stemming from all those liberal jurisdictions and leaders that have lectured DT and questioned his America First policy. As I always say, it never pays being an idiot, even if I clearly recognize the one “advantage” fools may have during a tough time is that their brain numbness is so profound that they won’t even realize what hit ‘em!
 [/vc_column_text][/vc_column][/vc_row][vc_row][vc_column][vc_column_text]
STOCK PICKS
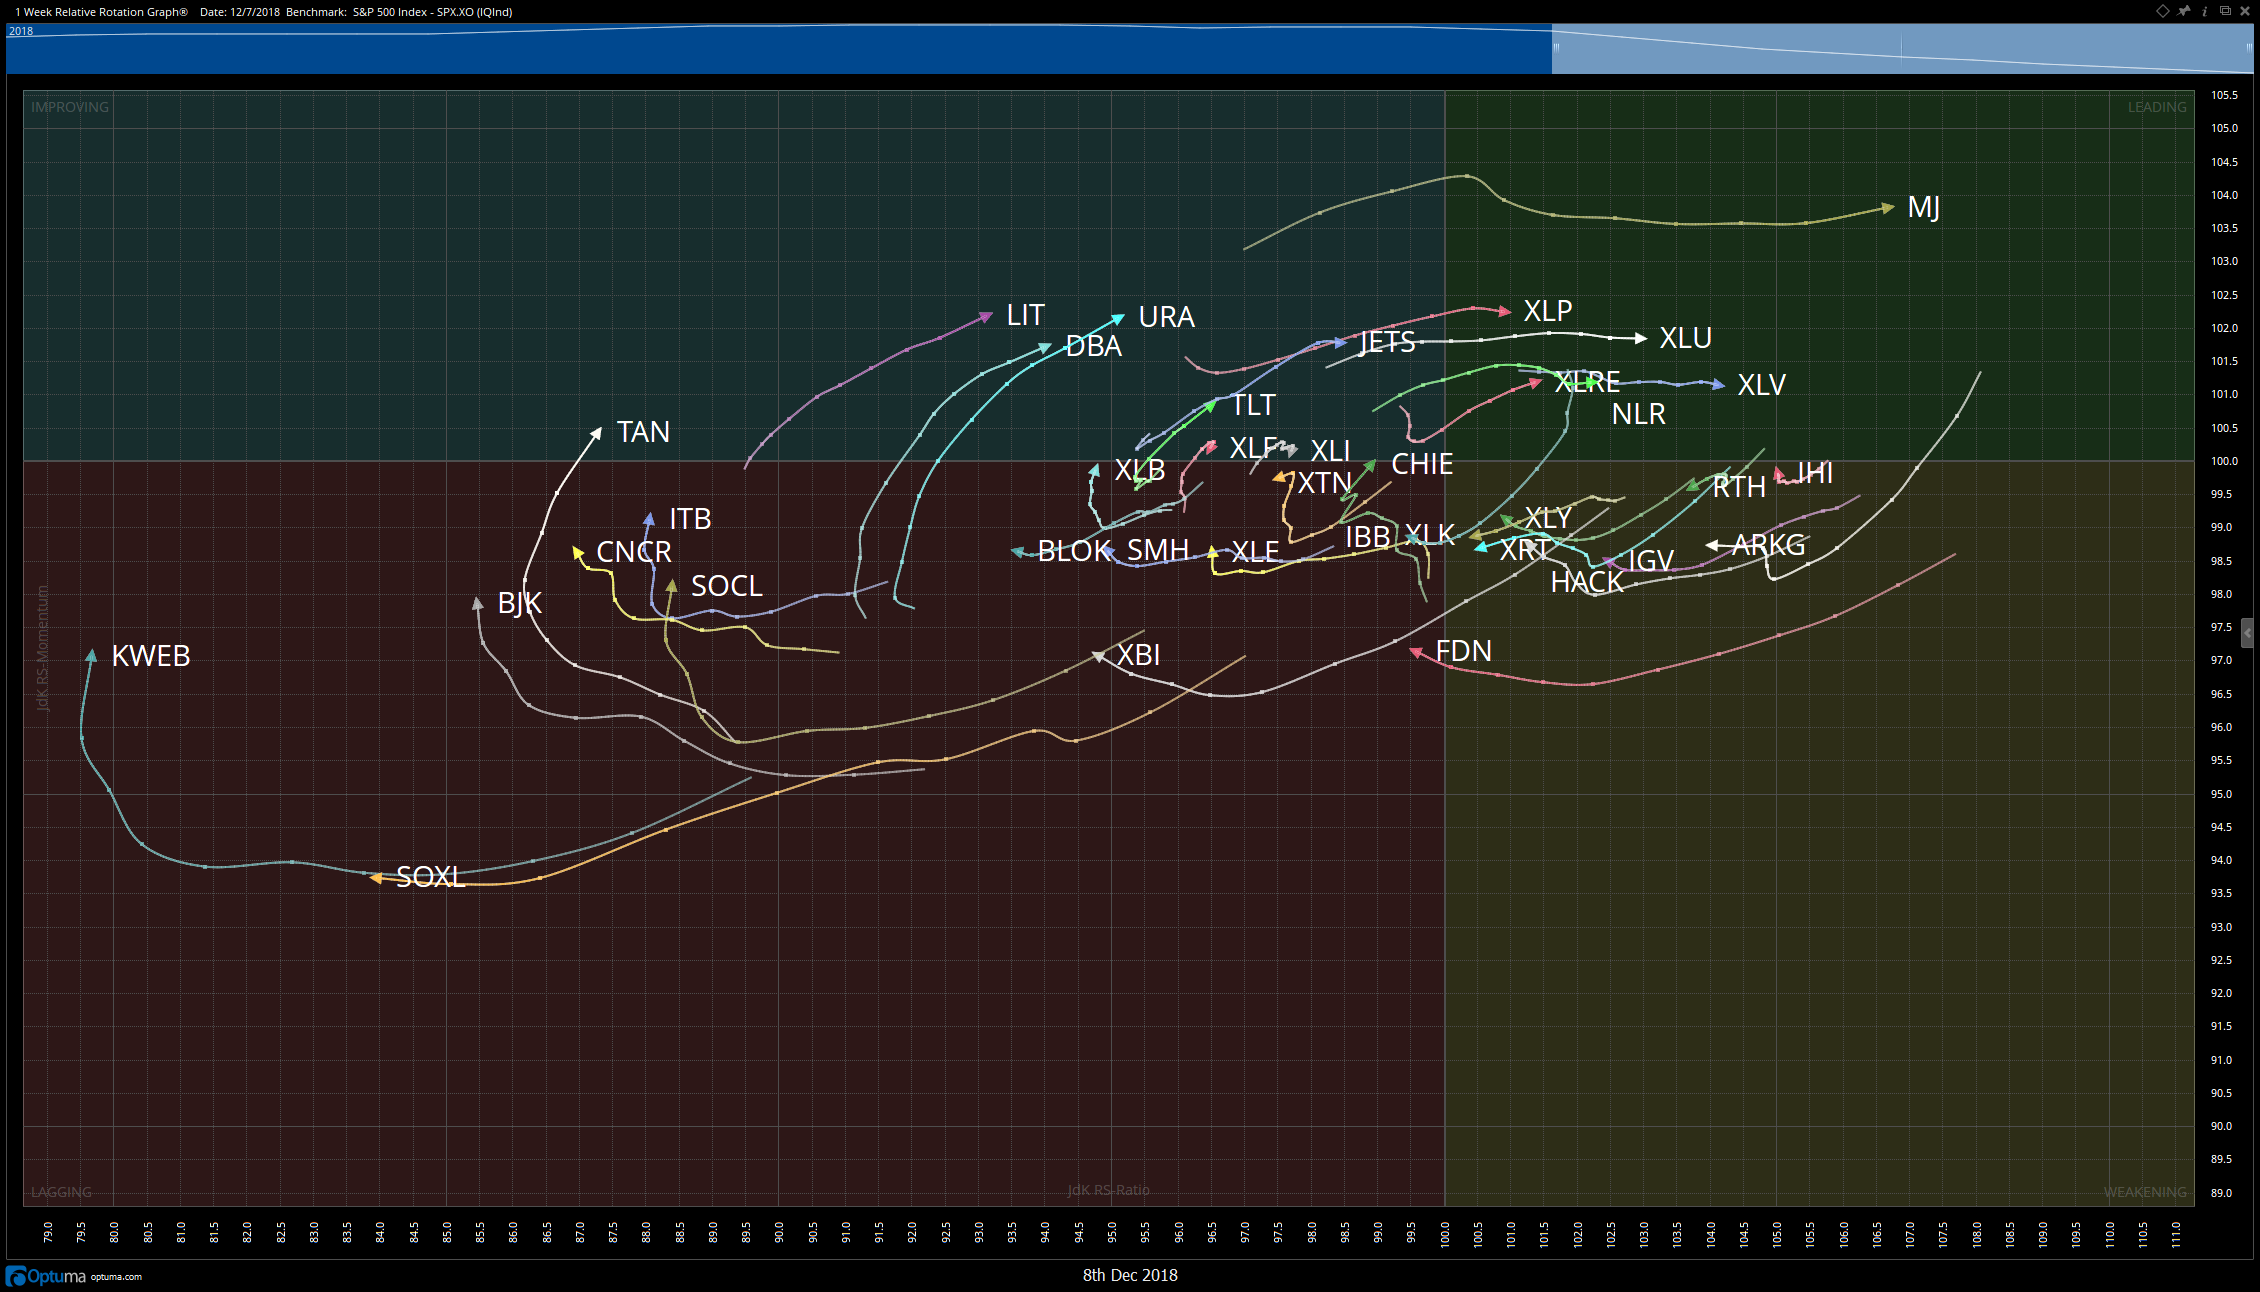
To note on this week’s RRG is the sharp turn up toward the Improving Quadrant made by the XLE, and the rotation in XBI biotech stocks and the gaming sector as shown by BJK. Energy stocks showed relative strength across the board in the midst of a fierce market sell off on Friday. While I like this sector, one needs to exercise caution with regards to adding too many energy names to a portfolio as they are strongly correlated with oil. This of course is a good thing when they are outperforming but works against you when Crude sells off. Not surprisingly, XLU made a swift move deep into the Leading Quadrant as investors fled to safety last week. We will watch for XLU weakness in the coming weeks as a barometer of risk appetite. Should the utilities stocks begin to show relative weakness, we may get a near term bounce in riskier assets.
- SQ
| DIRECTION | BUY ZONE | SELL ZONE | RISK/REWARD | VEHICLE |
| UP | 59-60 | 70-71 | -2/10 | OPTIONS |
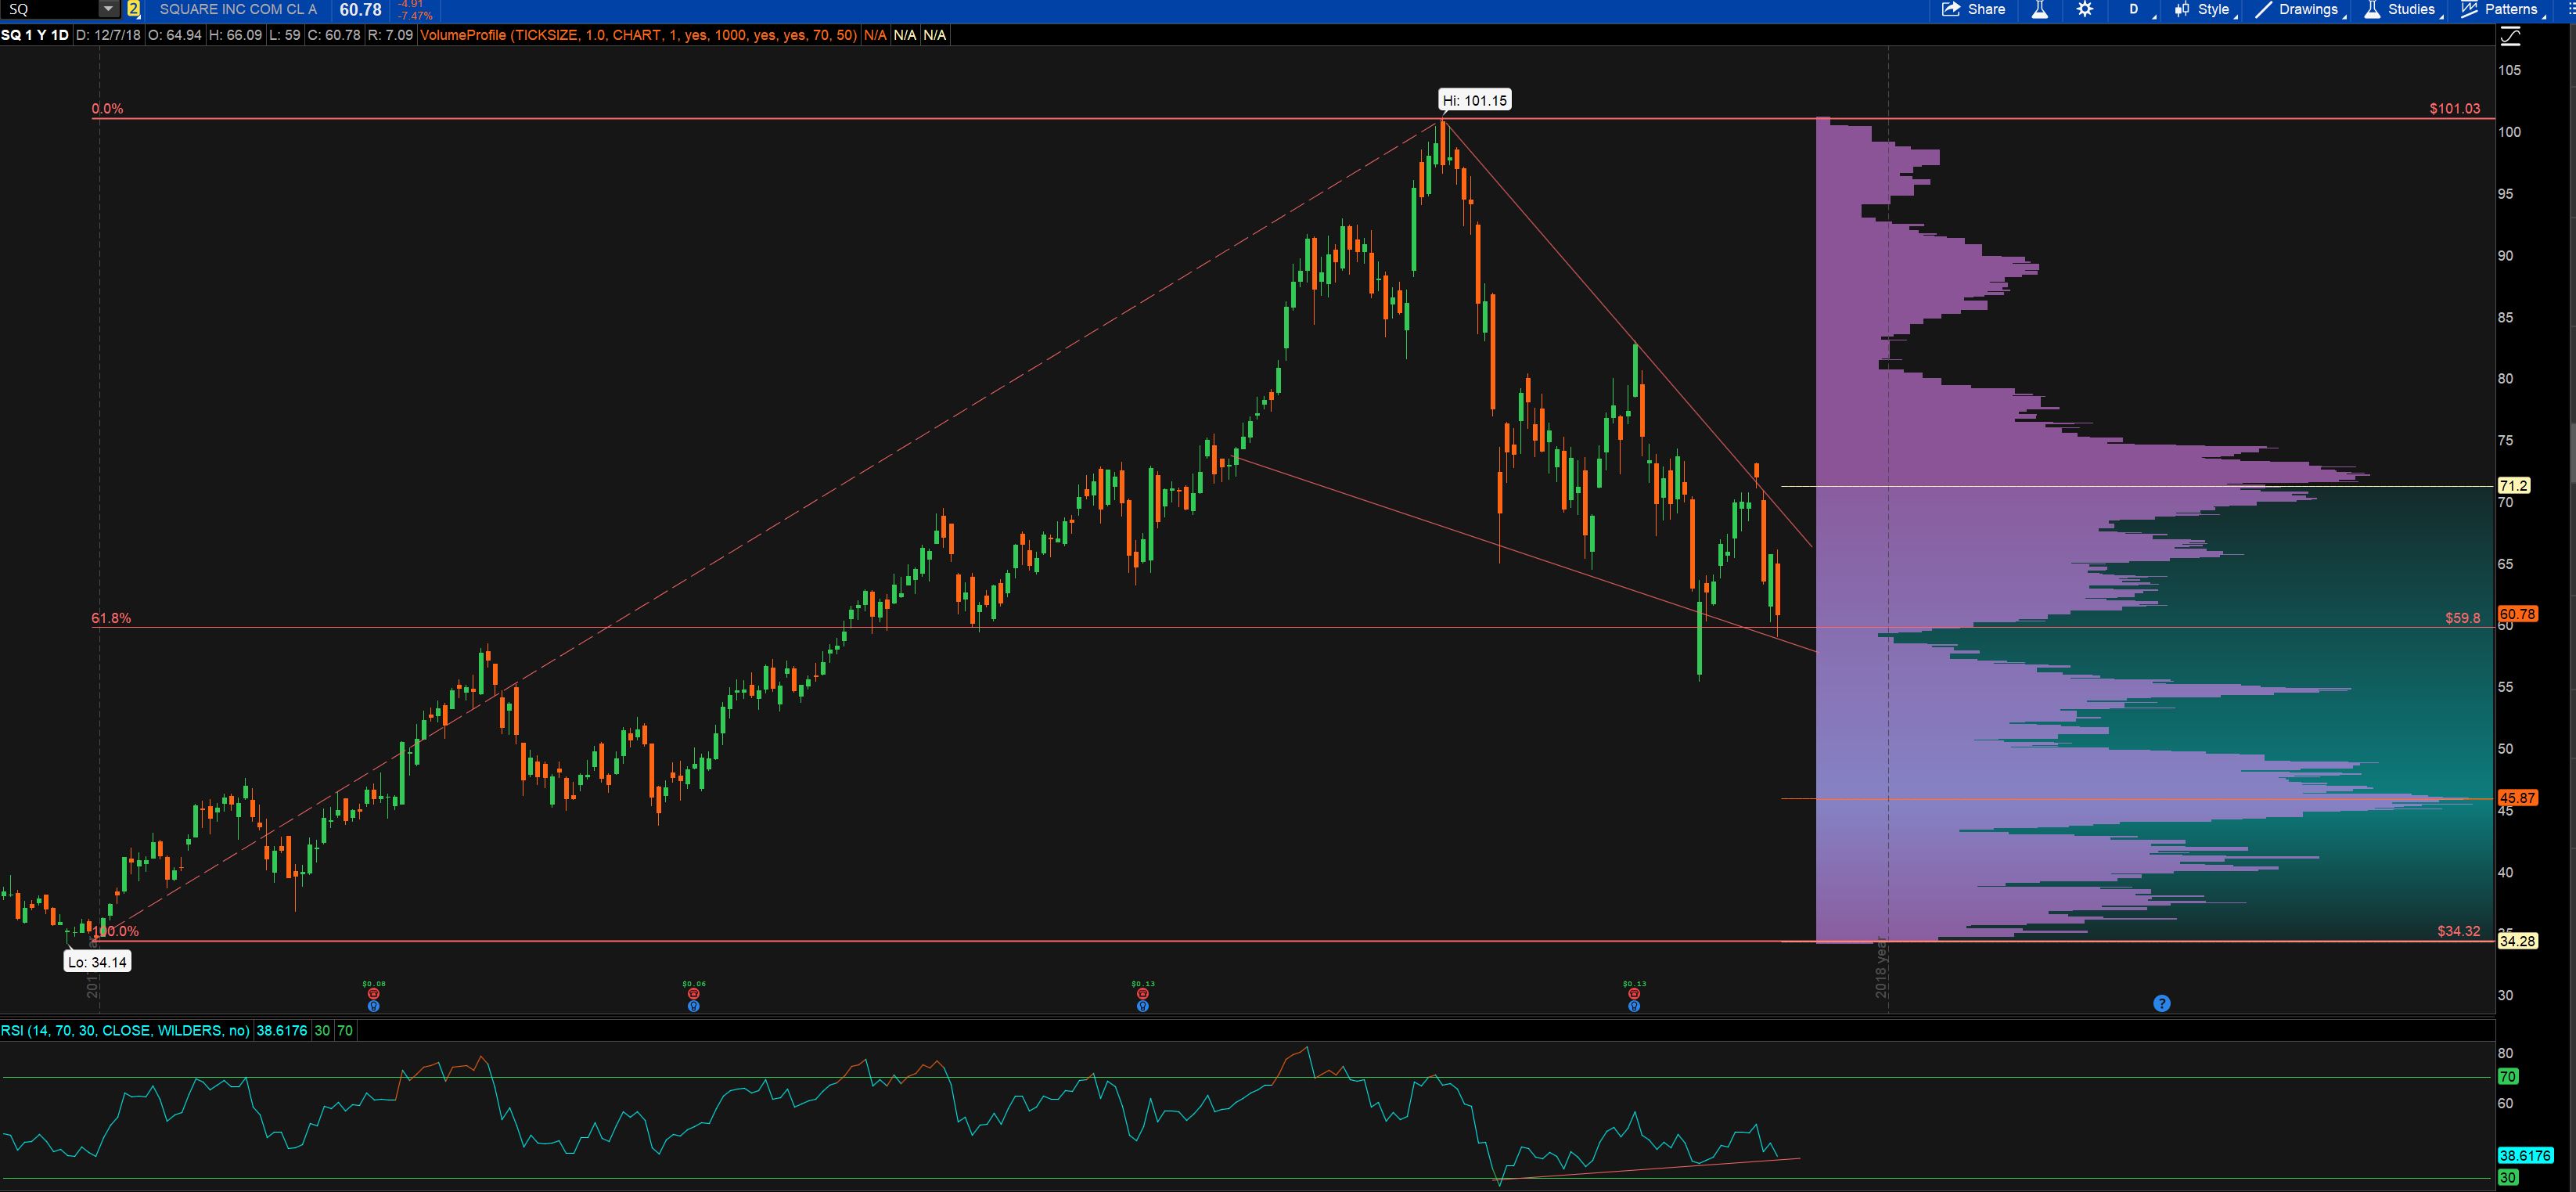
In our current market environment, I am almost embarrassed to recommend a stock like SQ. The one time darling stock of 2018 has been sold off with both hands as of late. However, I think it is due for a near term bounce and is providing a great setup via a falling wedge pattern here. You will also notice lower shadows have been left on the previous two daily candles and RSI has been putting in lower highs while price has fallen. The 61.8% Fibonacci Level has continued to provide support and I think it is good for a near term bounce. With a high VIX, ITM options will be used and as with all positions recently, tight stops will be adhered to.
2. YPF
| DIRECTION | BUY ZONE | SELL ZONE | RISK/REWARD | VEHICLE |
| UP | 15-16 | 20-21 | -.50/5 | STOCK |
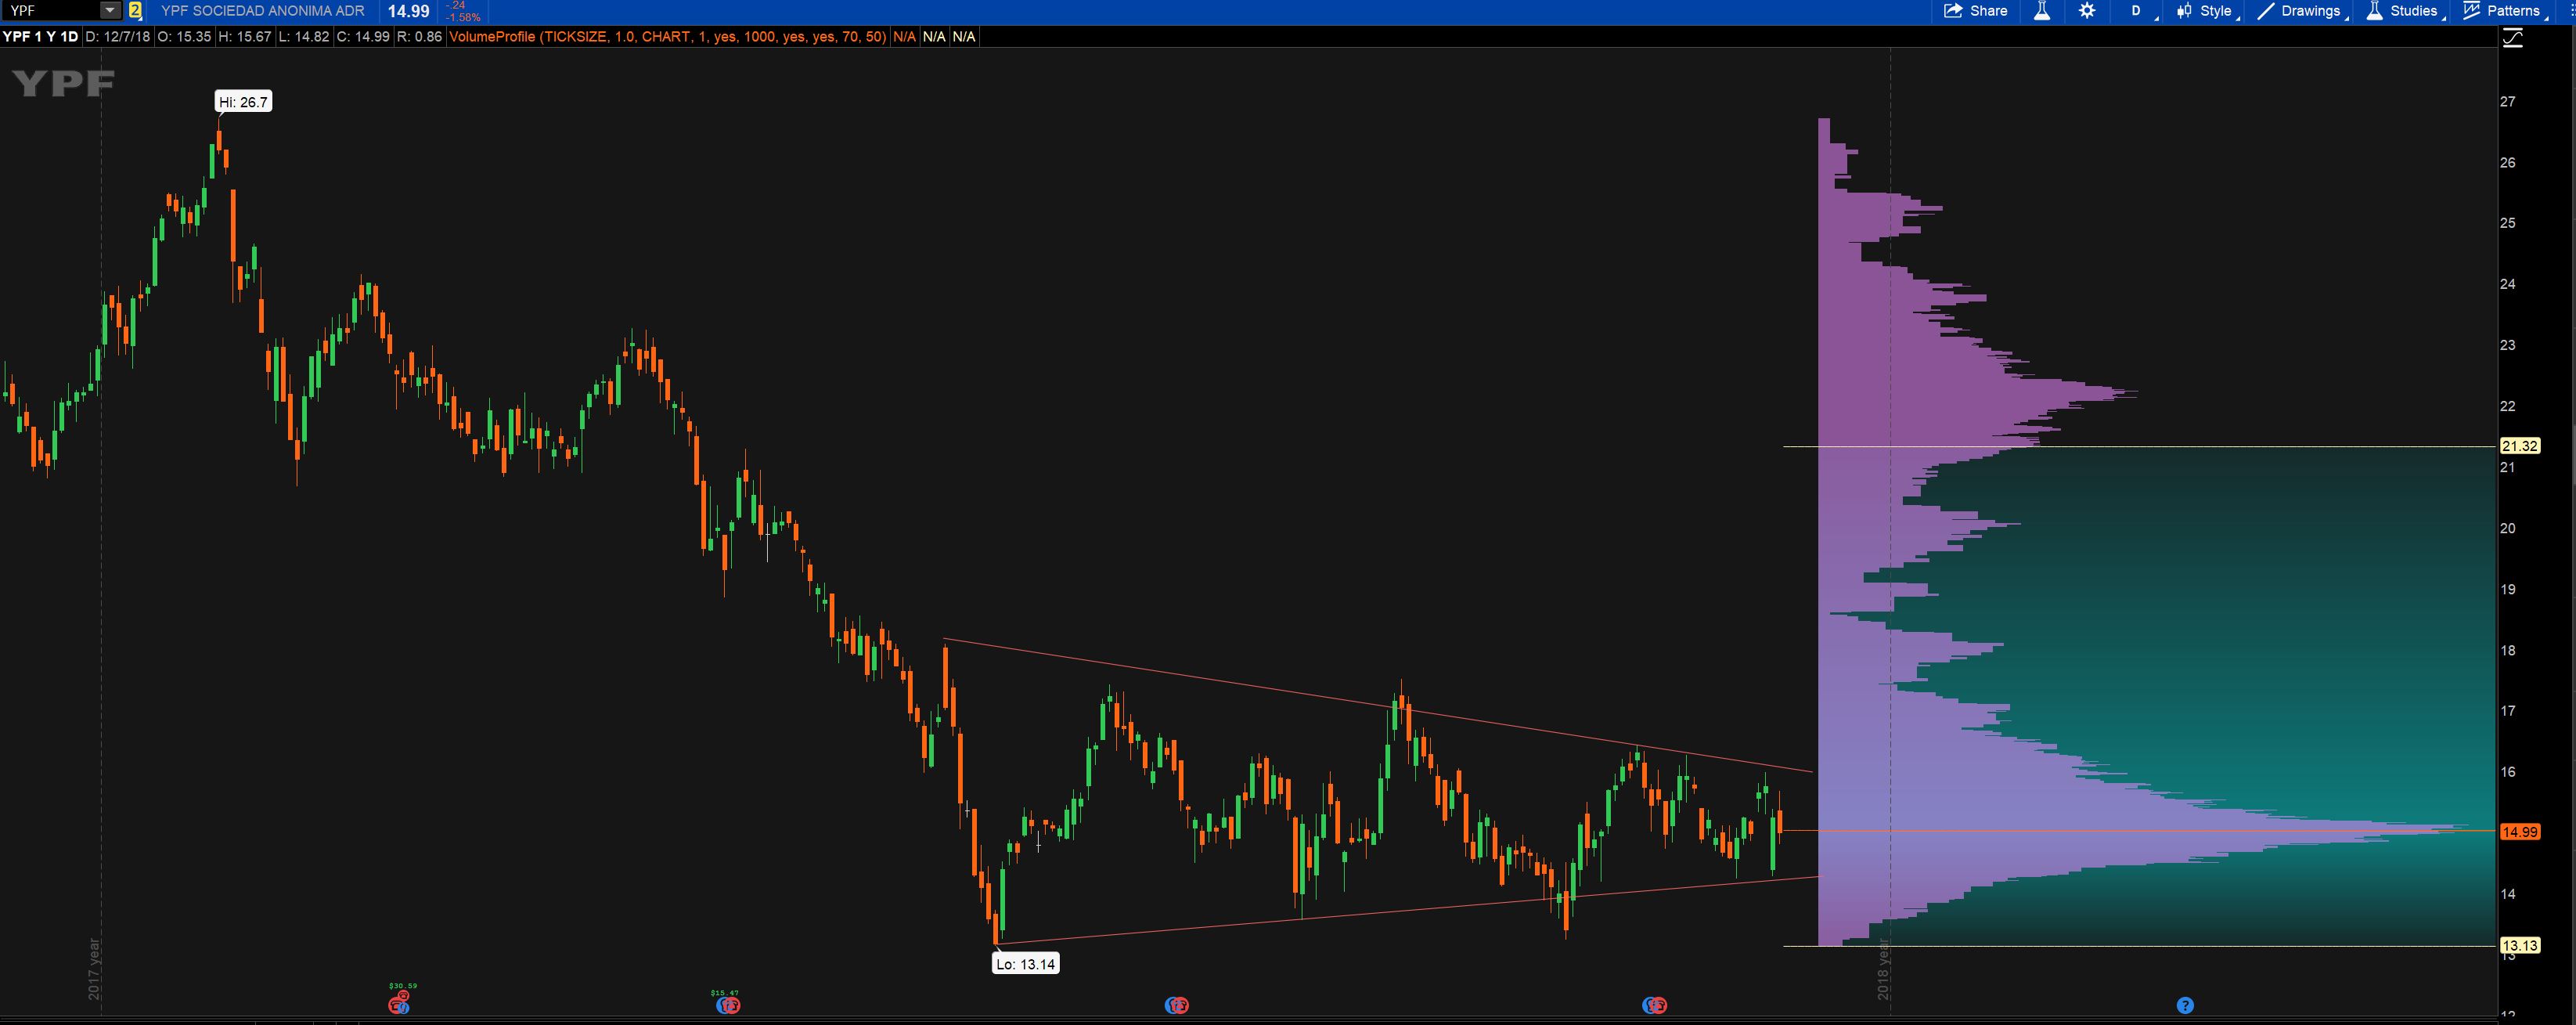
YPF got a head start on the overall markets by starting its own personal selloff from the start of the year. About the time the indexes began selling off, YPF had begun its consolidation range, giving us two boundaries from which to play. If the VPOC on the yearly chart continues to be below price, I will choose to play this from the long side. I think we get a bounce outside of this range and to the upside, but no matter what happens, we have a very defined range from which we will know where our thesis is wrong.
3. BYD
| DIRECTION | BUY ZONE | SELL ZONE | RISK/REWARD | VEHICLE |
| UP | 23.50-24 | 26 | -.25/2.25 | ITM OPTION |
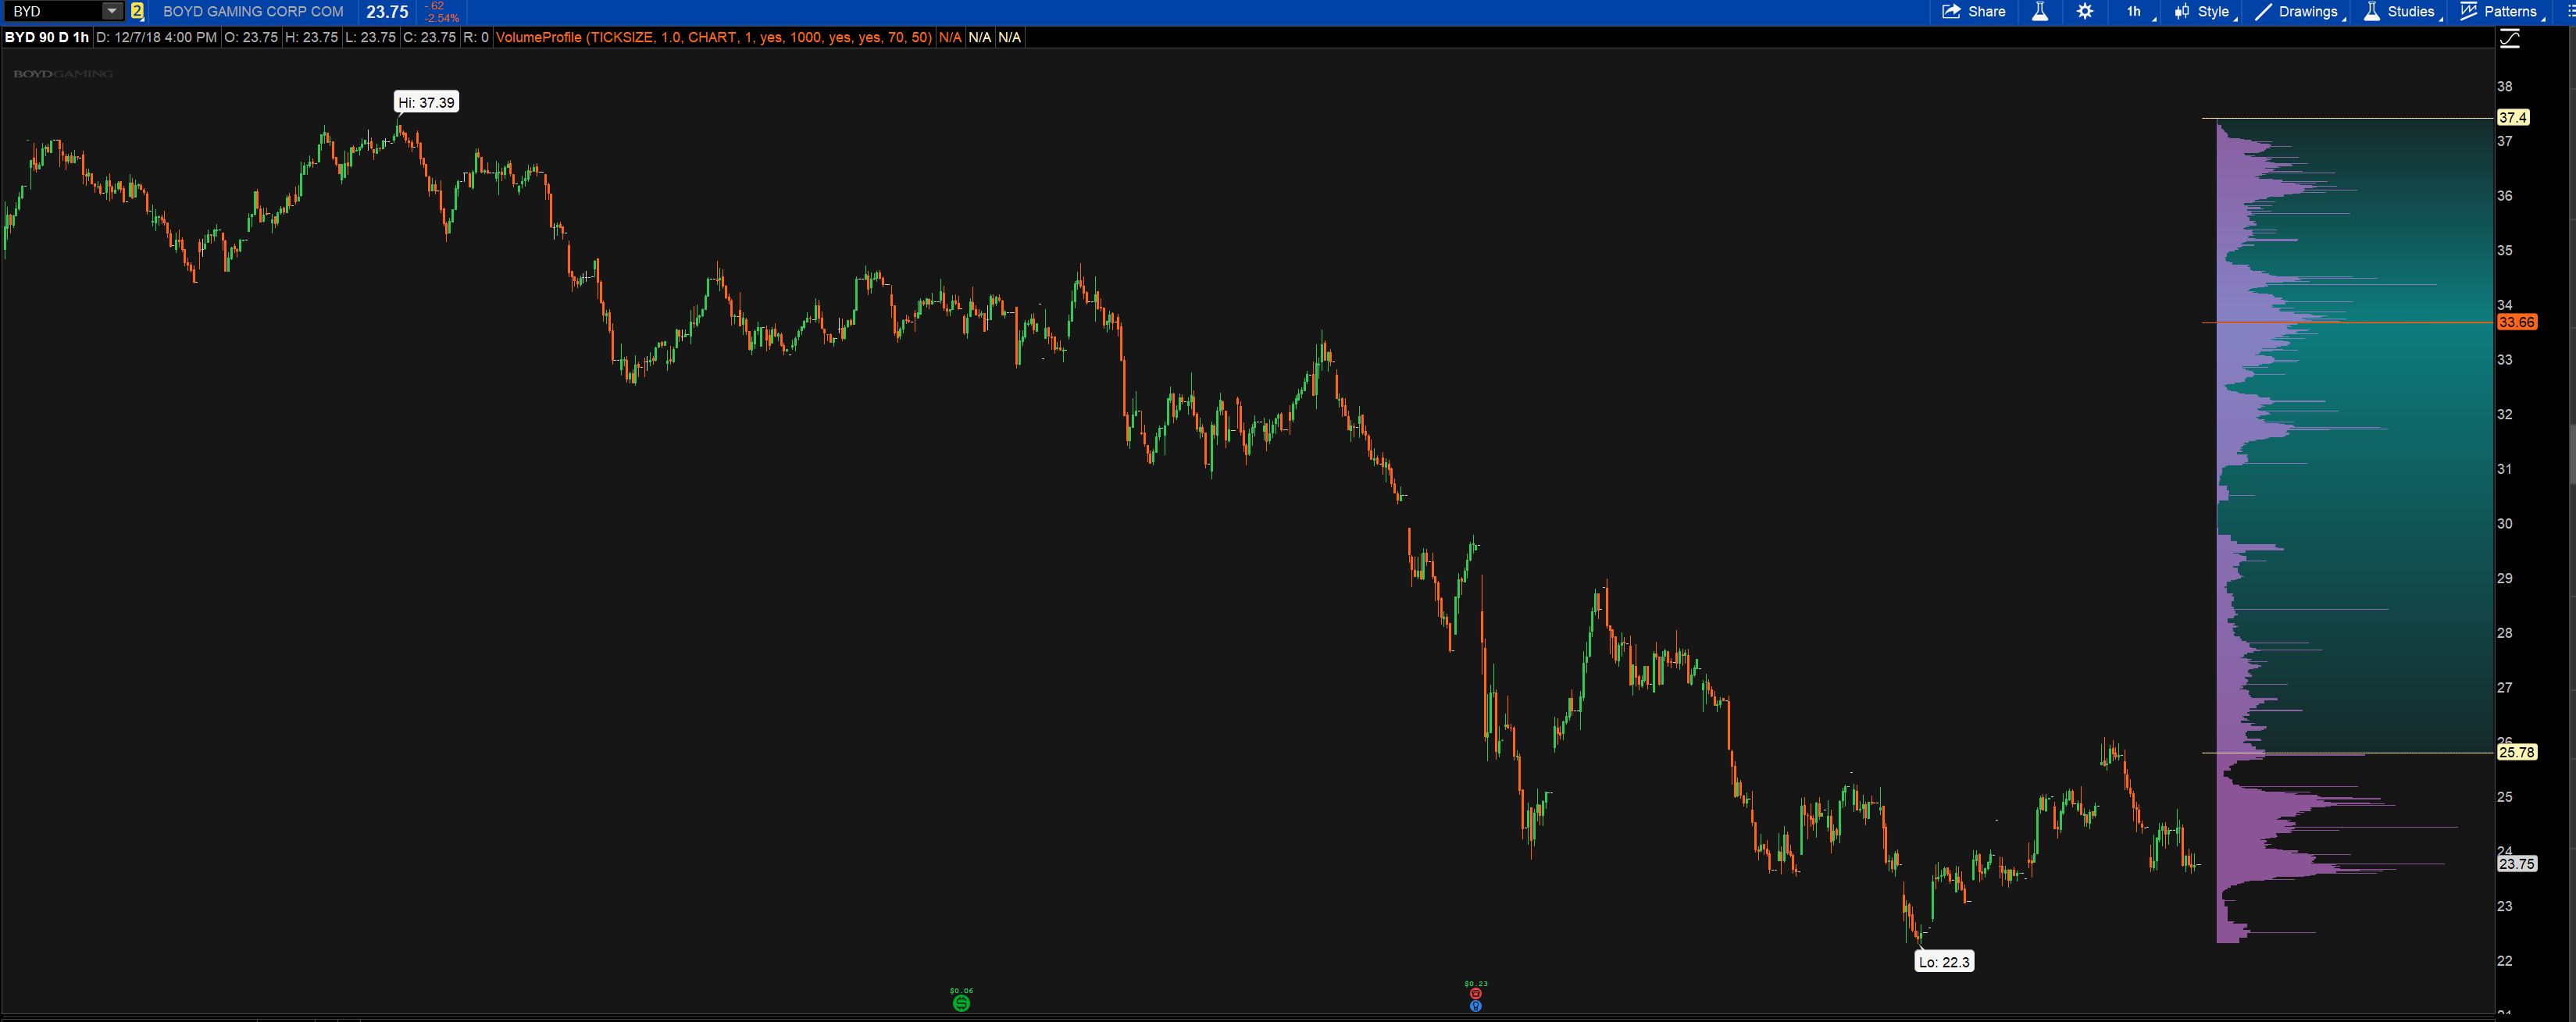
BYD is part of the BJK ETF which makes it an “okay house in a great neighborhood.” By that I mean that as BJK makes its way into the Improving Quadrant, it could take many of the casino and gaming names with it. You might be able to see a slight inverse head and shoulders look in BYD and perhaps the selling here is fatigued. Implied volatility on any of these gaming names is quite high so ITM must be used if you choose to use options at all.
4. CCJ
| DIRECTION | BUY ZONE | SELL ZONE | RISK/REWARD | VEHICLE |
| UP | 11.50-11.75 | 13.50-14 | -.10/2 | OPTIONS |
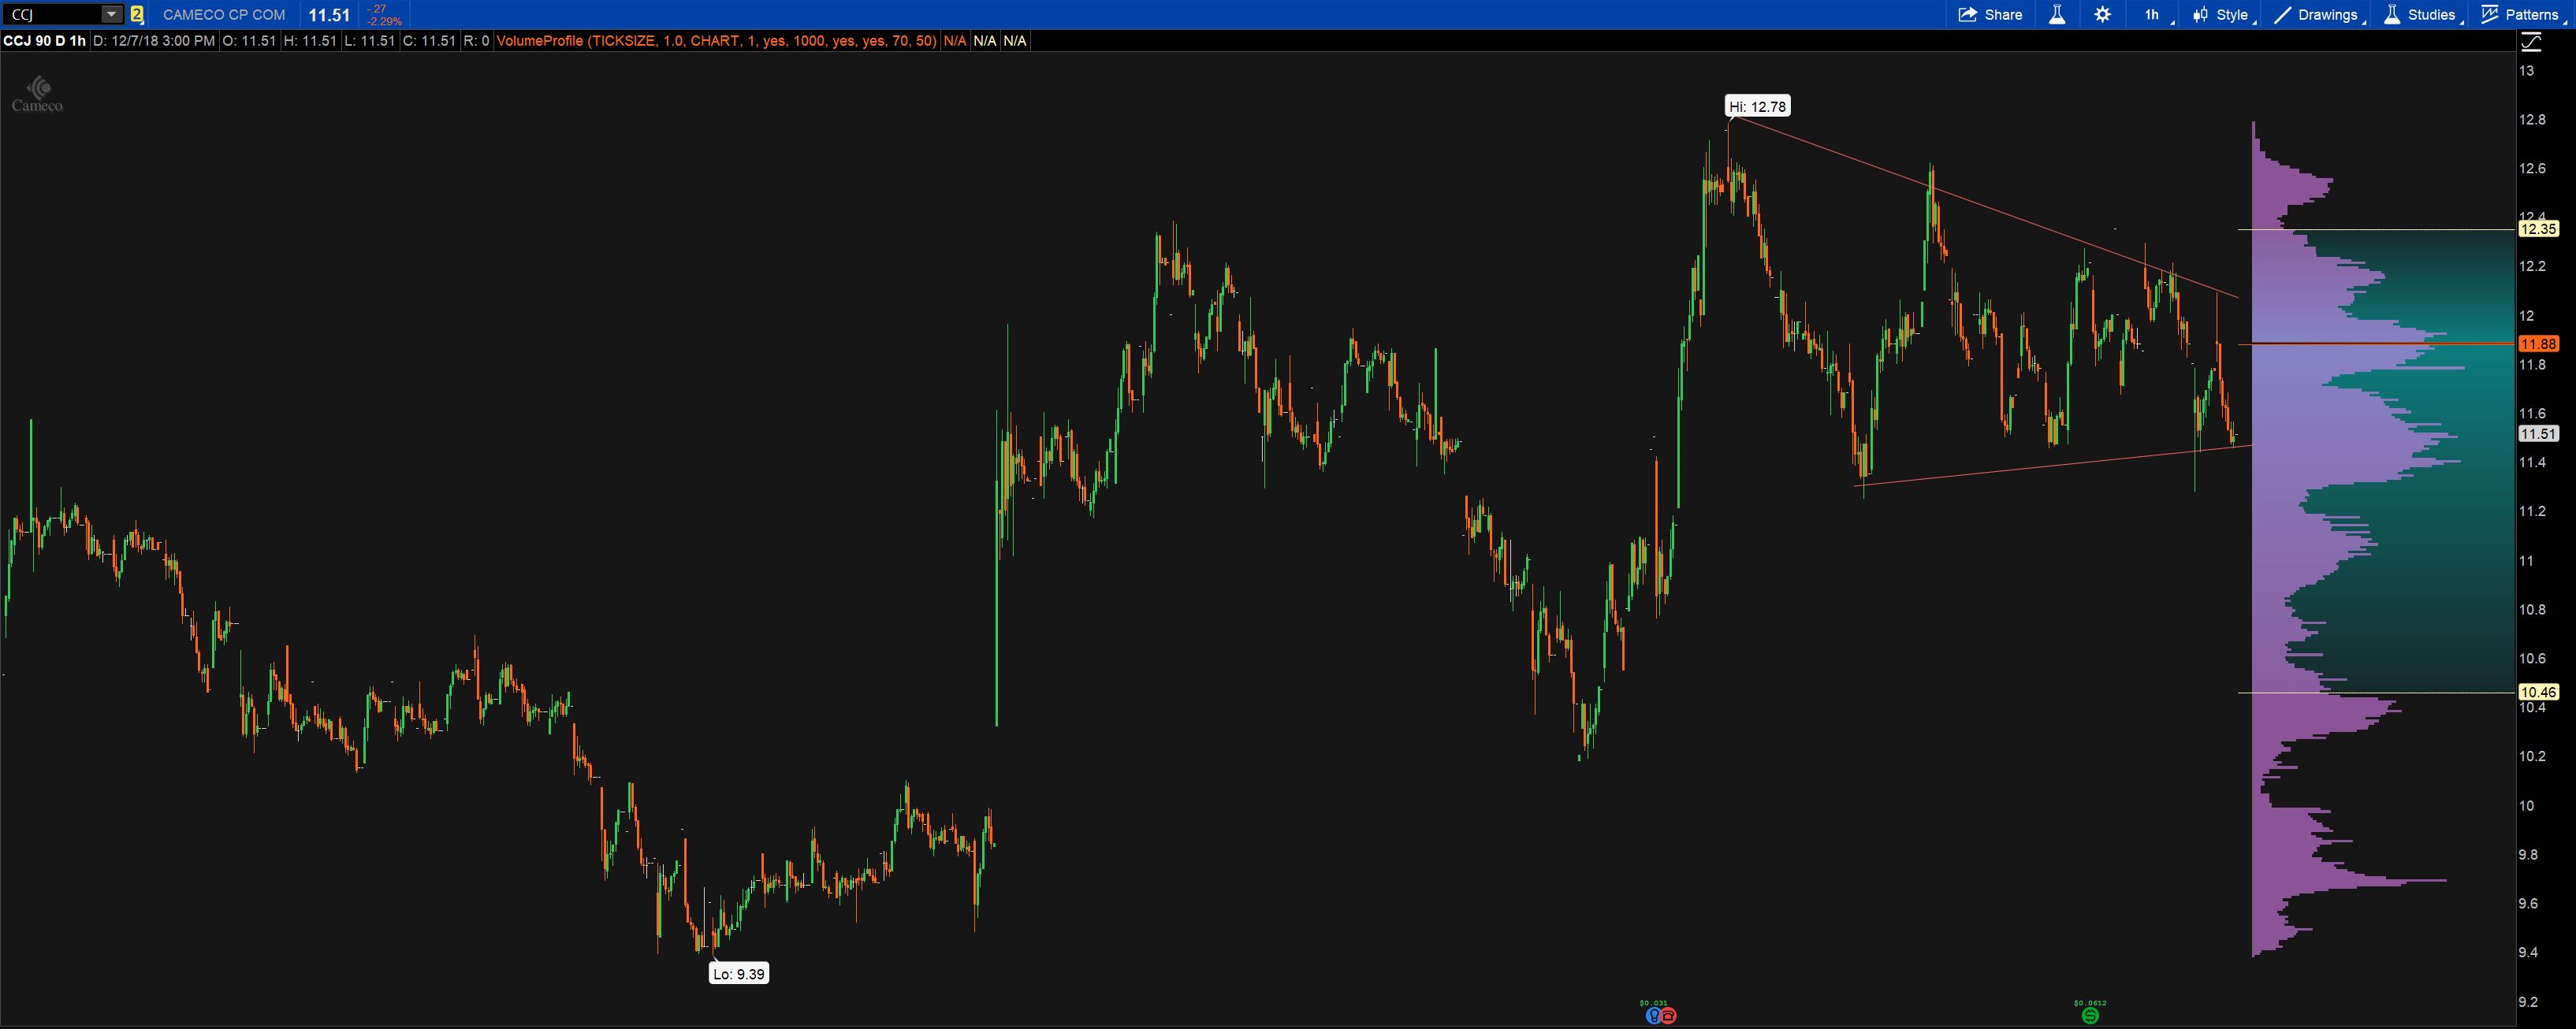
CCJ is a chart that still moves from the bottom left to the top right overall this year. We can see a nice pennant pattern has formed and price has come into the lower bound where we should feel comfortable buying. With support just beneath we can use ITM options to get long from right here. I would play for a breakout of the current pattern but watch for the intraday VPOC just above for a rejection which is midway through the pattern.5. CELG
5. CELGc
| DIRECTION | BUY ZONE | SELL ZONE | RISK/REWARD | VEHICLE |
| UP | 69-70 | 81-82 | -1/11 | OPTIONS |
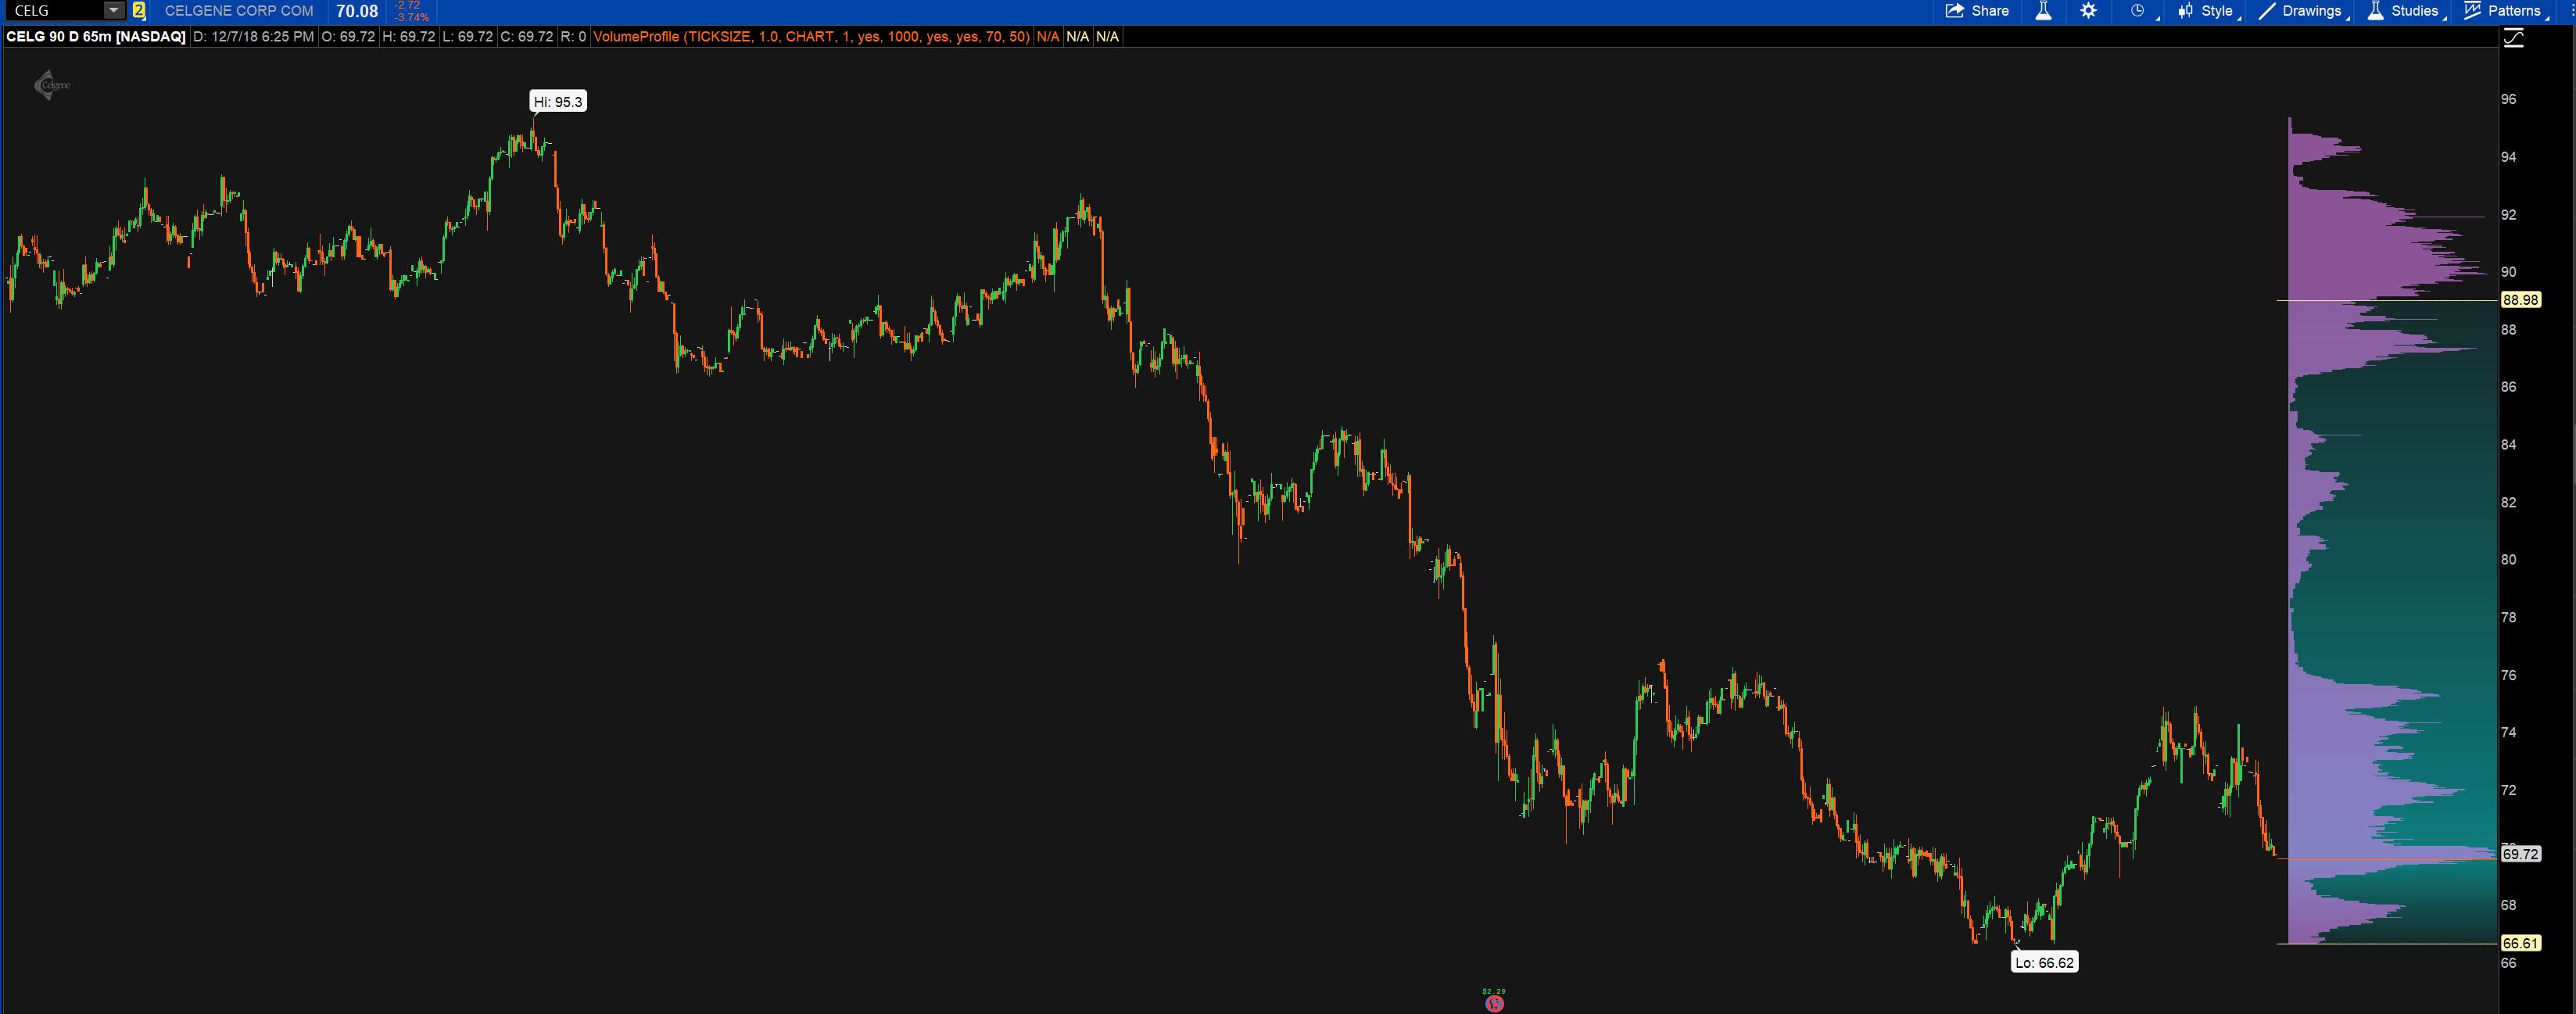
A scan of a couple thousand charts this weekend revealed a great deal of inverse head and shoulder charts, which I think can mean a near term bounce in a number of names. CELG in particular on an intraday chart has support just below from which we can try for a short term long. Should price give up this 69 level I would consider my thesis to be wrong and get out.[/vc_column_text][/vc_column][/vc_row]
