“Depressed” is becoming a state of mind
I am an Elliott Wave practitioner in part because Elliott is a great description of market behavior but more importantly because the Wave Principle is in fact a description of human social behavior. Bob Prechter’s studies in Socionomics are an exceptionally high caliber analysis linking societal developments with financial trends and I encourage you all to read into them. How trends in fashion, music, economy, peace and war, science and pretty much everything we do as a society correlates with the stock market to reflect aggregate social mood is a remarkable thing I’ve experienced for years; it never ceases to amaze me no matter how many times I notice it. And by the way, the idea that social mood impacts more than one societal development at a time is not new, Plato being the first to notice around year ’67 that “When the mode of the music changes, the walls of the city shake”.
To see how angry and depressed the mood is growing up out there just look at this collection of headlines tonight. I have chosen RT, Foxnews, Daily Express and Al Jazeera from Russia, US, UK, and Qatar, respectively. You can pick others, I am sure you will run into as much negativity.


Now, I am not going to get into the actual politics of these things because I have my opinions about them and I am sure so does everybody else. I just want to point out the correlation between the timing of a military skirmish in the Black Sea, tensions at the US – Mexican border, the de-facto defeat of the so-called Brexit deal before it actually made it to Westminster for a vote and the pan Arabic spat surrounding the Khashoggi story. All these happen after the major stock averages are retreating from potentially important secondary peaks.
So do prepare yourself for an avalanche of explanations in the next few days as the markets will likely be rattled. “Dow falls because Brexit deal jeopardizes large cap earnings” or “Russia tensions negatively impact tech stocks” are likely headlines early in the week. The reality, however, is that the market topped and got defensive a number of MONTHS ago. Here’s what I mean.
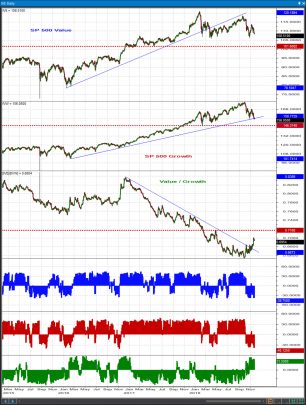
The chart above is a comparison of the S&P 500 Value, S&P 500 Growth and the ratio between them. For each instrument we have plotted our proprietary trend score measure – a custom study analyzing multiple money flow, momentum and volatility measures to break cycles into early, mid and late stage. Both SP500 value and growth styles are pointed lower, with growth declining at a faster pace. The tops in the ETFs and the bottom in the ratio have been recorded in late September and the deterioration to date appears to be the leading end of something bigger. The ETFs are approaching major supports right as the ratio runs into major resistance and the behavior to date makes it a higher probability event that the market will deteriorate beyond those levels. It takes a prompt rally of 8% PLUS to offer some relief and even then it may prove to be nothing but temporary, sort of like the round earlier this month.
The avalanche of bad news we seem to be getting is relevant not only because it is of a rather diversified nature in terms of geography and themes but precisely because it develops on a backdrop of rather bearish stock index patterns. This is really beginning to stink at this point as a major topping process in late stages but we’ll see. For my own account right now I have some Gold stocks – as per our chat last week – and lots of cash and I will require a lot of evidence before I change my attitude.
BOTTOM LINE ::::::::: Putting ourselves in front of this decline carries a significant level of risk at the moment. Cards seem to be dealt for a bigger blow to stock prices and possibly the economy. In some regards this level of tension and “anger” follows the Democratic win in the House and I find the correlation ironic given that the “victors” pride themselves with the ability to bring checks to the “off the chart” Trump Presidency. The investors are beginning to tell them they do not want to be “protected” from low taxes and more domestic production and investment in the American economy. And the investors are beginning to tell them they are rather concerned about the actions of the Democrats’ communist brothers in arms managing the EU which are about to blow up the whole of the European continent and with that create significant challenges for the world at large.
[/vc_column_text][/vc_column][/vc_row][vc_row el_id=”PATTERN ANALYSIS”][vc_column][vc_column_text]
Pattern Analysis
GENERAL STANCE::::: Nearby key resistances keep the immediate trend pointed lower. But if they are cleared, we will stand aside till a little larger bounce is consumed and then go short again.
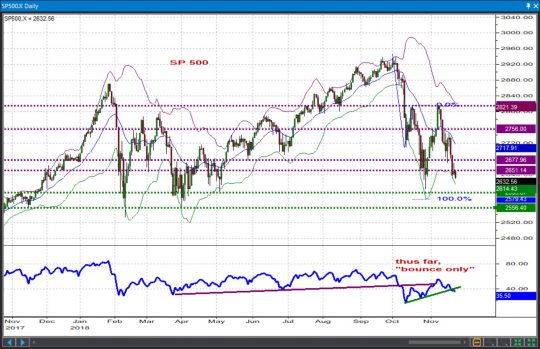
SP 500
The repel at 2820 and then 2750 and the new closing low for the decline from the late September highs we got last week are not bullish developments. Supports at 2615 / 2550 remain in focus unless prices push above 2677 / 2720. The situation becomes rather complicated below 2550. Pushes beyond 2760 / 2820 are needed to confirm bulls are regaining control.
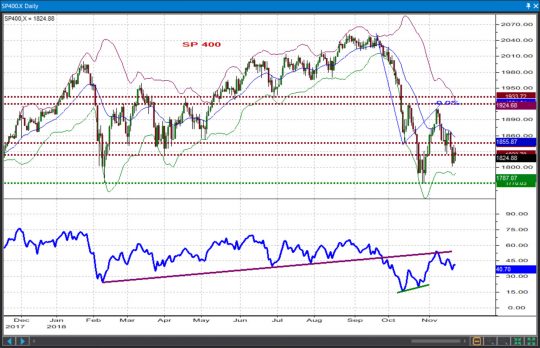
SP 400
Progressively more important resistances come in at 1856-66 and then 1925-1934. Overall we believe this index remain a sell on rallies until at least such time that the market takes a closer look at the 1770-1787 area. Pushes below 1770 will massively aggravate an already negative picture.
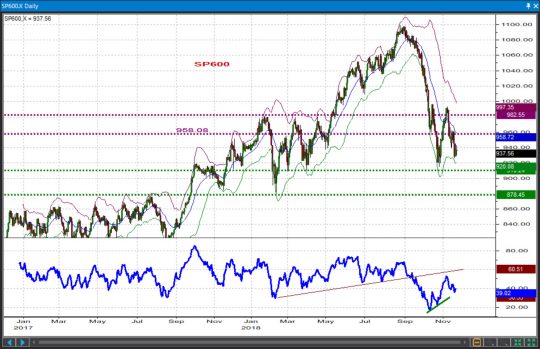
SP 600
Likewise, the small caps are likely to run into resistance around 958 or no later than 983-997. The focus remains lower for a test of the 915 / 878 supports. Pushes below 878 would at this point complicate an already ugly-looking chart.
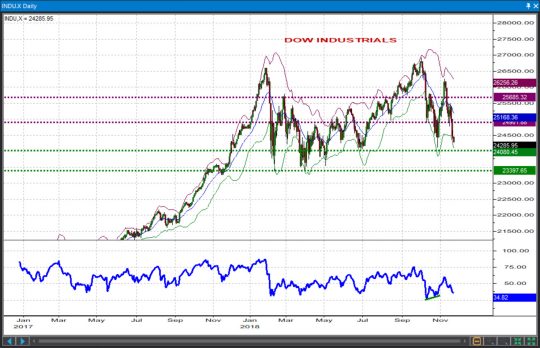
INDU
The immediate trend remains pointed lower while we trade below 24,900. The next supports are 24,080 and then 23,397. The picture is to deteriorate DRAMATICALLY if prices broke below 23,397.
NAS 100
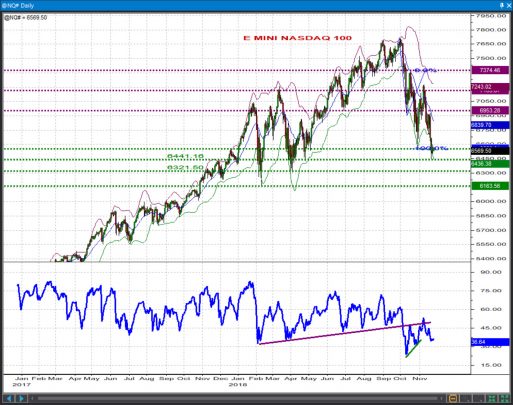
The Nasdaq 100 got kicked in the teeth more or less where it should have and sold off further. Prices ought to rally above 6750 / 6953 or more weakness into 6322 / 6164 is likely what will happen before any bottom building is attempted. Like in the other indices, even if nearby key resistance (6750 / 6953) is overcome, prices have to push up in excess of 8% for any rebound to be anything but a bear market rally so overall we remain biased towards selling rallies.
[/vc_column_text][/vc_column][/vc_row][vc_row el_id=”STOCK PICKS”][vc_column][vc_column_text]
STOCK PICKS
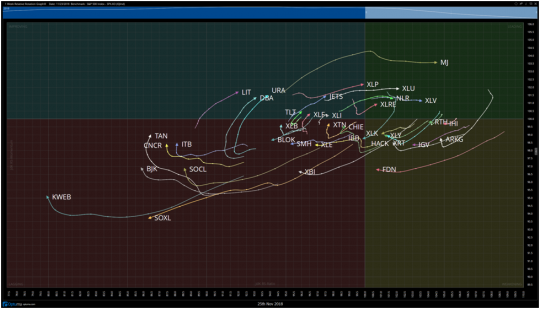
Of note coming into the post-holiday week are the number of what I would call “risk on” groups that are turning upwards towards the Improving quadrant. KWEB, BJK, SOCL, CNCR, and TAN are all looking to make a move into improving. It could be that some of these groups have been sold off so hard that a near term rally is in the making. We will be keeping our eyes on these industry groups as well as the continued strength in the marijuana stocks as a group.
BIDU
| DIRECTION | BUY ZONE | SELL ZONE | RISK/REWARD | VEHICLE |
| UP | 181-183 | 193-194 | -1.50/11 | OPTIONS |
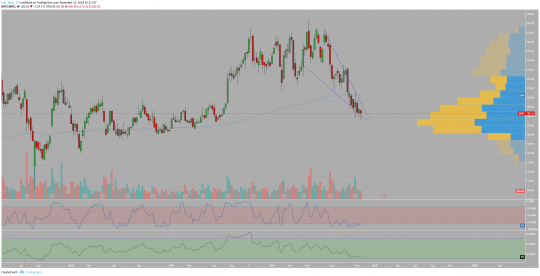
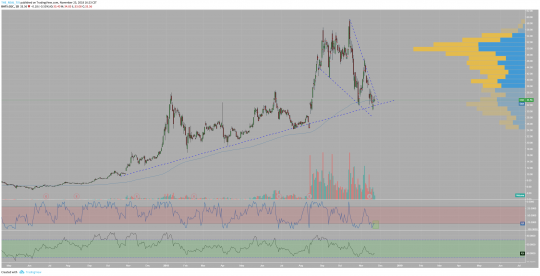
BIDU is wedging lower into the VPOC on the weekly time frame, leaving lower shadows below signaling bulls defending this price level. As illustrated by the RRG, the KWEB (China Internet ETF) is beginning to turn up towards the improving quadrant. As BIDU is a part of this group, I expect it to be one of the first to make a short-term bounce. I like it right here and now.
CGC
| DIRECTION | BUY ZONE | SELL ZONE | RISK/REWARD | VEHICLE |
| UP | 32-33 | 38-39 | -1.50/5 | OPTIONS |
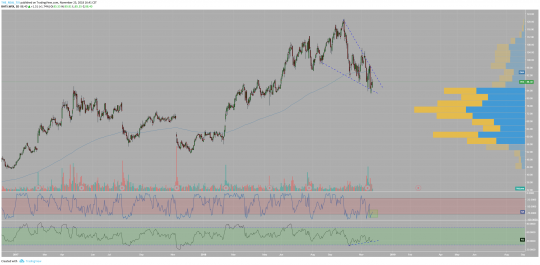
CGC has a few things going for it. First, it has been wedging lower and is coming into long term trendline support. Second, price is supported right at these levels by the 200 day EMA. Finally, Williams %R shows that CGC is currently oversold but looking to make a move back up into the midrange. Further, a member of the marijuana stocks which still remains in the leading quadrant on the RRG, I still think it has a good chance to pop right from these levels.
WIX
| DIRECTION | BUY ZONE | SELL ZONE | RISK/REWARD | VEHICLE |
| UP | 84-86 | 95-96 | -3/8 | OPTIONS |
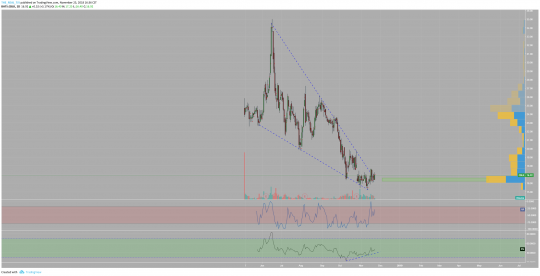
WIX much like BIDU is wedging lower into a bed of price by volume support. I expect the selling to slow and buyers to make a stand near these levels. RSI is making higher lows and Williams %R shows that it just crossed into the midrange from oversold territory (a bullish signal). This will be one of the first names I look to play this week.
CBLK
| DIRECTION | BUY ZONE | SELL ZONE | RISK/REWARD | VEHICLE |
| UP | 16-17 | 22-23 | -1/5 | OPTIONS |
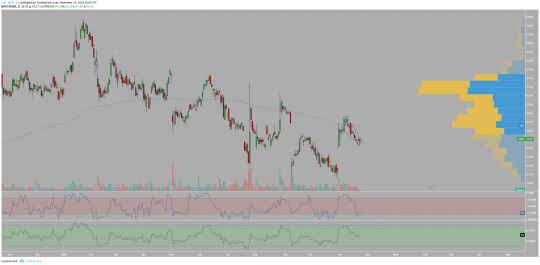
Making its 2nd appearance on a top 5 watchlist, I think CBLK is close to breaking out and I like the risk reward from these levels. It seems to have found buyers at these reduced prices and has stabilized. Watch for quick follow through higher in the early going this week.
YUMC
| DIRECTION | BUY ZONE | SELL ZONE | RISK/REWARD | VEHICLE |
| UP | 34-35 | 40-41 | -1/5 | OPTIONS |
Post YUMC’s earnings gap higher, price has wedged lower, flagging back into the level where price made an initiative move higher. We often find that these areas provide support and I fully expect that to happen here as this name trades hand in hand with the KWEB industry group.
[/vc_column_text][/vc_column][/vc_row]
