[vc_row el_id=”COMMENTS”][vc_column][vc_column_text]
Clouds keep gathering and are getting ever darker
ANNOUNCEMENT :::::: Trent and I have been working on multiple files in the past few months and you are going to begin to see some results. The OmahaCharts weekly letter will gradually become more in-depth in its analysis and we will now separate the stock signals in a service that will reach you with stock alerts when it has to. The S-Trader platform I have been developing for 3 years is to be released shortly – RRGs, portfolio systems, trading systems, custom indicators based on a very simple scripting language and a whole bunch of other cool stuff are in it. The effort we’ve put is remarkable in terms of breadth and scope and I personally apologize for whatever schedule imperfections we may have had in the past few weeks but it has been total madness for both of us. Do never hesitate to get in touch with us by email or skype to ask questions, we always answer. And if you bear with us just a little longer, things will get back to normal and we will have a remarkable arsenal of tools to use – and make money with!
In order to make sure you receive the alerts by email, please go to http://alerts.omahacharts.com/?cookieCheck=true

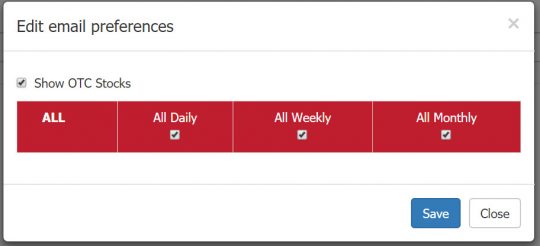
login with your username and password and then edit your email preferences.
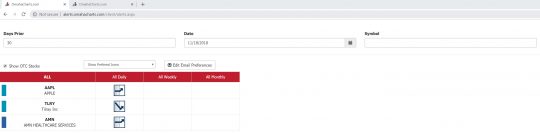
You can choose to receive short, intermediate and long term alerts for all available stocks. We recommend you subscribe to all.
Now back to markets, a lot of things are happening right now and most of it just doesn’t feel right. Yes we do have a bounce going on here but its legs do not seem – at least not to date – particularly strong. In this context news and events feel bearish and have the potential of getting far worse – especially as it relates to Brexit. Precious metals as an asset class as well as a commodity group are waking up. Something’s happening here.
Before I proceed with actual patterns and market analysis let me put the Brexit thing into perspective. The British government was supposed to secure an orderly withdrawal from the European Union. The EU political elite is nothing but a bunch of despots who regularly spit on the sovereign will of people expressed in referendums; they systematically disregard referendum results and just charge ahead with their project of political integration through the back door. They have now found a tremendous ally in Theresa May in their attempt to block Brexit. As it comes out, Mrs. May has not negotiated but rather colluded with Brussels in proposing a so-called “deal” whose implications would be to transform the United Kingdom in nothing less than an EU colony – it is actually worse than a REMAIN option, perhaps deliberately so. The arrangement proposes full payments of fees in exchange for being blocked in the customs unions which would peg the UK indefinitely to the single market and the European Courts of Justice system. Theresa May offered everything and got nothing in return, achieving in essence exit in name only. The “deal” is so bad that the better part of the British political establishment, most of them REMAINERS, can actually not support it. With Tory Brexiteers up in arms against Mrs May the country is facing deep political crisis and a major leadership battle probably this week. The problem is this can lead to a snap election in which case there is physically no time left to agree on anything ahead of the March 29th withdrawal date. And if it doesn’t, the next PM is a Brexiteer so in both cases the probability of a hard Brexit – which is what I always thought would happen – would increase dramatically. Major consequences would result for Eurozone’s economy which I personally think would be ravaged on one hand because of loss of internal frictionless trade and on the other hand by the forceful relocation of EURO denominated derivatives trading from London – which would implode EUR denominated credit markets. The British would suffer too, but comparatively to a far lesser extent. Either way, significant economic challenges would ensue on a global scale.
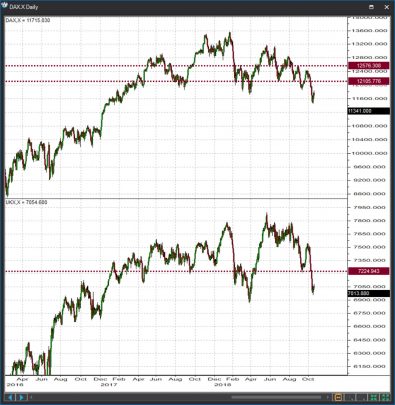
In this context, 3 technical developments are currently capturing my attention. The first one is the breakdown in the German DAX Index and the rather difficult position of the UK FTSE 100. Neither market is an example of tremendous bullish energy as you can see below. It is true, however, that it wouldn’t take much to invalidate the current bearish setups but at the time I write this piece the position they’re both in is a vulnerable one. The DAX in particular has started your classical sequence of lower highs and lower lows that defines a downtrend. The FTSE is above its early 2018 lows but not by much and is already making lower highs and lower lows at the lower degrees of trend.
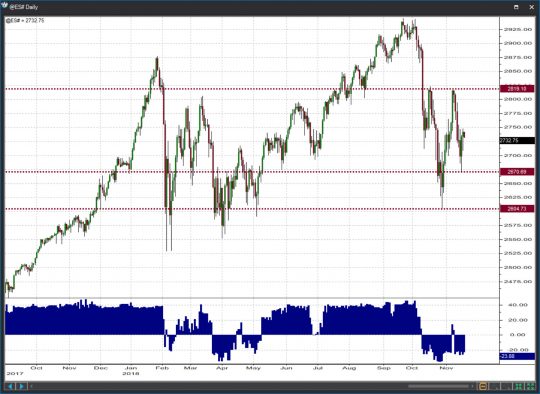
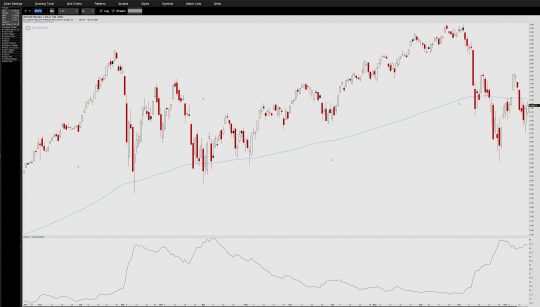
Then, the S&P 500 stalled at the crucial 2820 area and overall more weakness appears due perhaps for at least a retest of the 2670 / 2605 zones. Our proprietary score indicator has turned bearish recently and quite frankly without a push above 2760 / 2820 it will stay that way for at least a little while longer. We do expect US stocks to do better than European stocks on a relative basis no matter what, but that does not eliminate lower US stock prices from this position altogether. It may just mean that the SPX will not fall as fast as the DAX or FTSE in the event of a Brexit accident.
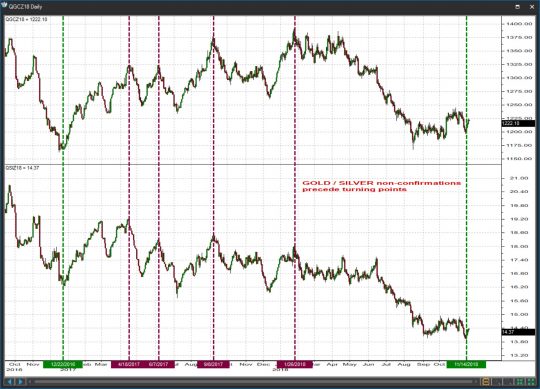
 Finally what makes me really rather nervous is the behavior in Precious metals. Gold leads silver at every market turn and silver ends up overdoing gold in both directions. In that regard we must note three things now:
- There was a Gold / Silver non-confirmation this past week whereas a new low in Silver went unconfirmed in Gold. As you can see in the chart below most turning points in the past few years developed with such occurrences.
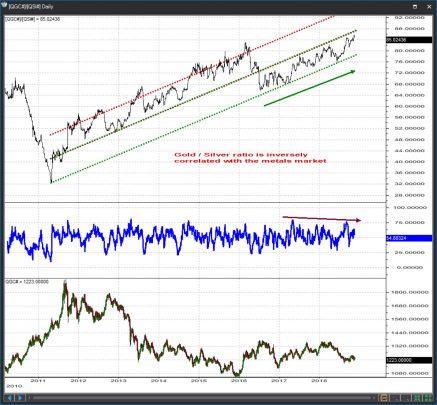
- The Gold / Silver ratio is typically inversely correlated with metal prices. In other words when metals rise, Silver rises faster than Gold and when metals fall Silver falls quicker than Gold. The ratio is at the end of a 6-7 years old uptrend and is in a situation of bearish momentum divergence whereas ratio velocity has failed to confirm the recent new highs in the ratio
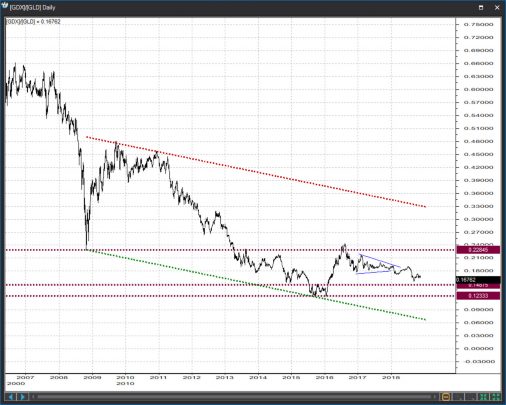
- The ratio of GDX to GLD, i.e. Gold miners versus Gold bullion, is in a unique short-term bottoming configuration. Without a push below the 0.1230 lows of 2016 the ratio is very likely to double over the next 6-12 months. When Gold stocks outperform Gold bullion, metal prices ALWAYS advance.
What we see at the moment in terms of inter-market analysis is not very friendly for stocks. On the contrary, actually, the degree of risk may be the highest we’ve seen this year, indeed in the past several years. Most of the positive things we’ve seen a few weeks ago are beginning to disappear after what looks like a corrective bounce from the late October lows which I cannot be highly confident will hold at this point – in fact I am almost sure they won’t. The group that we’d most logically own at this point is precious metals stocks and whatever you want to attempt otherwise make sure you do not violate key money management principles and make sure you do use some stops. This does not feel like a time to marry any long positions………[/vc_column_text][/vc_column][/vc_row][vc_row el_id=”2nd part”][vc_column][vc_column_text]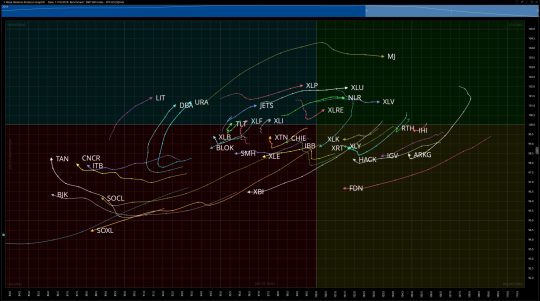
Coming into a shortened holiday week in the U.S. Equity Markets we want to focus on a couple of industry groups in looking for relative strength: TAN and CNCR. TAN is the solar industry group ETF while CNCR is the index focusing on cancer immunotherapy drugs. First Solar (FSLR) is one of my largest long term holdings and I also hold stock in CSIQ and SPWR. I’ll be doing a deep dive into the CNCR components this week and watch for alerts for possible trades there. I also hold CNCR as a long term position.
As I wrote last week, the CBOE Implied Correlation Statistic remains above its 200 day moving average leading to excess risk if holding too many stock positions at one time. $SPX ATR is also elevated, meaning market speed is the new normal.
In these conditions it is prudent to have a few good trades on with objective risk reward measures and staying nimble is of extreme importance as a trader. The good news is, Omahacharts Alert Service is ready so going forward the alerts will be timely, delivered to your email instantly. Expect the same type of format with charts and risk / reward profiles but on a dynamic basis throughout the week instead of static, over the weekends only. There will be an alert tomorrow, likely after the first hour of trade so be on the lookout for that and be sure to let us know if you do not receive it.
I hope you all have a great holiday week and our blessings to you and yours throughout the holidays.
Trent and Marius[/vc_column_text][/vc_column][/vc_row]