Announcement
We will post index analysis sometimes after close on Monday NOV 12th.
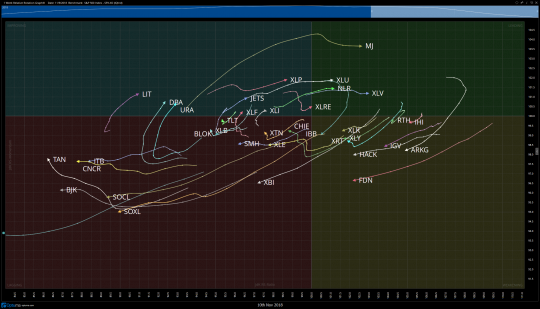 While volatility has tapered off from the highs experienced throughout October, we remain in an environment that favors the intraday trader. The bulk of the reader base here at Omahacharts is sophisticated, and by this I mean they know that daytrading is an extremely difficult endeavor over any length of time. Taking into account the higher cost of commissions, taxes for short term gains, and playing against sophisticated algos and HFT outfits, the risk reward usually isn’t in our favor. That being said, this environment has been rewarding if you can bank gains quickly when you have them, and move on to the next trade. We are in a “stock market” where correlation among the majority of stocks is high, and the most recent news headline has the propensity to wipe away your hard earned gains. This is in opposition to “a market of stocks” where individual names move independent of one another, and are not held hostage to the latest China Trade Deal headline, no matter how real or fake. The CBOE puts out a statistic called the SPX Implied Correlation that I pay attention to…
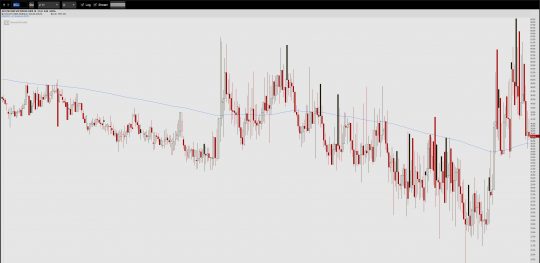
As the $ICJ falls, correlation among stocks drops and stocks move independently of one another. This is a market of stocks and is great for stock pickers. When the $ICJ moves above the 200 day moving average as it is now, the environment favors quick moves, less individual stock picks and taking gains when you have them. In other words, it doesn’t matter as much which stock you own, if the market’s latest headline is positive, your stock will trade higher, if negative, lower. Stocks trade in lockstep, swayed by whatever the overall market views as positive or negative.
This is simply an explanation as to why over the past several weeks the letter has included only 5 trade setups (and I PROMISE the Alerts Live Service is almost ready). Less is still more, and I cannot recommend strongly enough that you have a rules based system in place for taking gains and cutting losers. Make a simple system where you will take gains of 100% off the table and cut losers at 40%, no questions asked. Whatever the system that works for you, make sure it is setup to be profitable taking into account taxes and commissions and most importantly that you don’t break the rules. Soon, this service is going to feature a running P&L system complete with ratios that fund managers look for like Sharpe, Treynor, and Sortino Ratios. All in due time…
[/vc_column_text][/vc_column][/vc_row][vc_row][vc_column][vc_column_text]
Weekly Stock Picks
CBLK
| DIRECTION | BUYZONE | SELLZONE | RISK/REWARD | VEHICLE |
| UP | 15.25-16.25 | 23-24 | -.50/8.00 | OPTIONS |
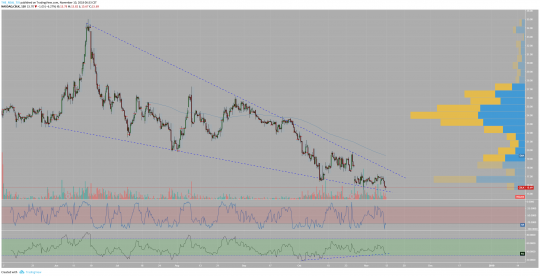
Part of the spring 2018 IPO class, CBLK has been wedging lower. Most recently we see momentum diverging bullishly while daily candles have begun to leave lower shadows signaling buyer support beneath current prices. The overall look of the pattern is nearly textbook and I expect a pop back up quickly to the lower bound of the value area (not shown) near $19, and ultimately up to $23-24.
CORT
| DIRECTION | BUYZONE | SELLZONE | RISK/REWARD | VEHICLE |
| UP | 12.75-13 | 17.50-18 | -.25/5.00 | OPTIONS |
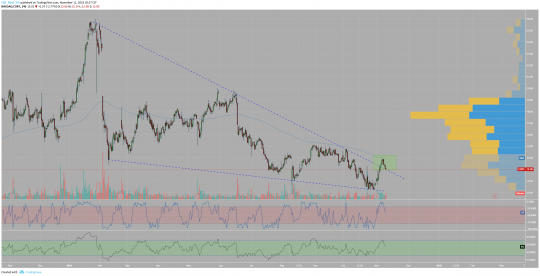
A textbook breakout and retest of a longer-term downtrend is in play here. CORT also has had some strong insider buying as of late. This is another statistic that is prudent to follow. Insiders can sell securities for any number of reasons (fund a new home purchase, send a child to college, etc.) but they buy for only one reason and that is because they believe that their stock is undervalued and will be worth more in the not so distant future. I like this to trade higher. Watch for resistance up near the VPOC around $18.00.
RIG
| DIRECTION | BUYZONE | SELLZONE | RISK/REWARD | VEHICLE |
| UP | 10-11 | 13.50-14 | -.50/3.00 | OPTIONS |
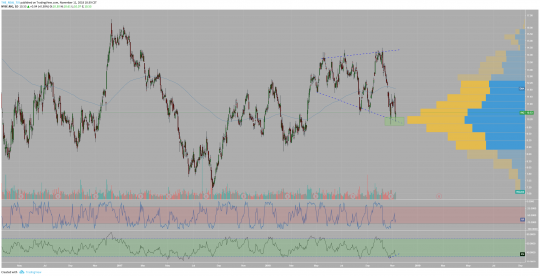
RIG has found itself at the lower boundary of a broadening (megaphone) pattern. Immediately beneath current price levels we have the VPOC, the lower boundary of the pattern and some long lower shadows showing buyer strength. In playing these patterns this year, we have gotten a lot of follow through higher when entering the trade at the bottom of the pattern as opposed to the midpoint which hasn’t worked as well. I like this as a long into the end of the year.
CRC
| DIRECTION | BUYZONE | SELLZONE | RISK/REWARD | VEHICLE |
| UP | 25-26.50 | 50+ | -2.50/25+ | STOCK/OPTIONS |
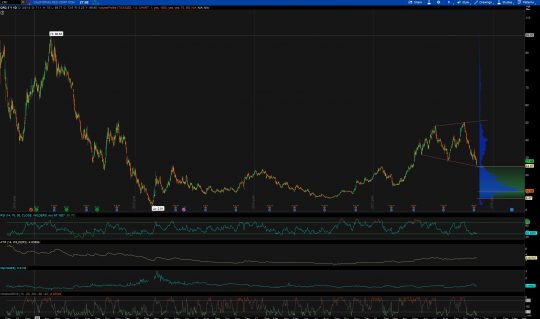
CRC is taking on the same pattern as RIG, and I expect it to trade back up to the top of the broadening formation in the coming months, and beyond longer term. The stock has a high short interest, so short covering rallies can become fierce. I purposely zoomed out, taking into account 5 years worth of daily history so you can see how thin the profile is above and how big of a base of support has been built below. I could own both stock and options here and with RSI just recently hitting oversold territory, now is a good time to begin buying.
PAYC
| DIRECTION | BUYZONE | SELLZONE | RISK/REWARD | VEHICLE |
| UP | 123-125 | 137-138 | -4/10 | OPTIONS |
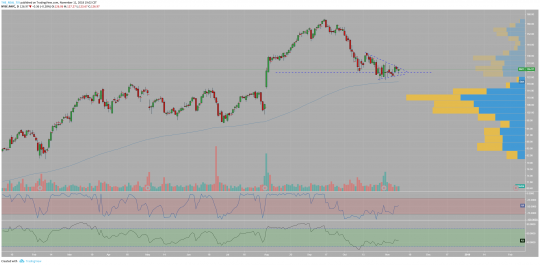
PAYC is a stock with the ability to move sharply and it is trading down to an area which in all likelihood will be supported beneath by bulls. Back in August the stock traded higher, gapping up on heavy volume and put two initiative days in in a row. Coming into these levels while consolidating should provide a decent entry soon. We also see that over the past couple of years anytime this stock has approached its 200 day EMA it has spiked higher. This will likely be one of the first trades I take this week.
[/vc_column_text][/vc_column][/vc_row]