Emotion on steroids – More to come or almost enough for now?
ANNOUNCEMENT :::: our stock alerts service will be delivered in a different format very shortly. All preparations are in place and we are conducting final tests on the new platform which to date has behaved as expected. We will contact you with details as to the new service very shortly.
Over the past few months we’ve talked about the many difficult alignments we thought made the market short-term vulnerable. What you saw during October is part of what we meant. On a long-term basis we would not be surprised if October 2018 ended up being, in retrospect, the early warning to a far bigger shake-up and adjustment. But on a short-term basis what happened today in the final hour of trading may have positive implications. It is probably a bit early to get really excited but we feel compelled to notice what looks to be like initial signs of capitulation.
I am only saying it may not because I want to hedge my view but because I want to inspire you to adopt proper risk management as we’re trying to cope with a potential turning point here. The long-term picture in the stock market is one of late cycle development and we do not know when the market could begin to really surprise to the downside. There is no reason why it wouldn’t already do so from the current configuration so a simplistic contrarian stance strictly based on the touch and feel of capitulation at today’s low will carry the immense risk of a massive loss in the event the market actually broke down hard over the next few weeks in continuation to this difficult October. Like I always say, the trading profession is about both the art and the science of carefully calibrating risk-reward ratios rather than the precise exercise of accurate forecasting. We do have to give ourselves some leeway and not expose our accounts irrationally in the event some things don’t play out exactly like or in the sequence we think they will – which is always what happens.
Philosophically, it is a reasonable probability event that if we stabilize above the 2018 lows we will begin building energy for the final intermediate up cycle – or that at least we will get a significant rebound here and begin the stabilization process after another rout early in 2019, I haven’t made up my mind in that regard. A few things look to be beacons of hope right now – and that is aside from the massive wave of panic selling we witnessed today during the final hour that was quickly reversed:
- Price action over the past week or so, while wild, looks structurally corrective. I strongly suspect a falling wedge is unfolding on intraday charts in most indices. That is a terminal little wave that will ideally be followed by a significant rebound in November;
- Every move to a new low since OCT 23rd developed on a backdrop of positively diverging momentum. This would be an ideal case scenario for the market’s momentum condition during an unfolding falling wedge;
- The small cap stocks are starting to show early signs to turn up on a relative basis against large caps, all while the USDollar is refusing to decline. You would think that a severe stock market decline would threaten the prospects of rising rates in which case you would expect the Dollar to begin falling. Instead the Dollar keeps going up and it is beginning to put a floor under small cap stocks;
- Price action in Gold is not consistent with a massive risk-off event, as it remains confined to the normal limits of an upward correction. That is consistent with still-persistent upward bias in interest rates and with a stock market scare of relatively limited nature at this point.
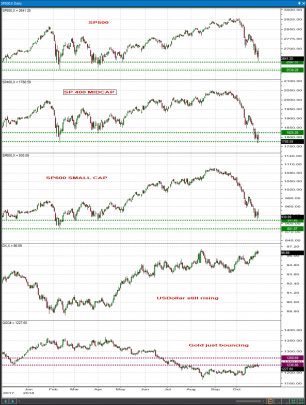
If hostilities start unfolding in a manner diametrically opposed to points 1-4 above and if the 2018 lows start to give way across most indices, we would promptly reassess. For now we may have elements to cautiously turn a bit more hopeful than most players seem to be and without further dues let’s look at the pattern analysis to see where the key points are in the major indices.[/vc_column_text][/vc_column][/vc_row][vc_row][vc_column][vc_column_text]
SP 500
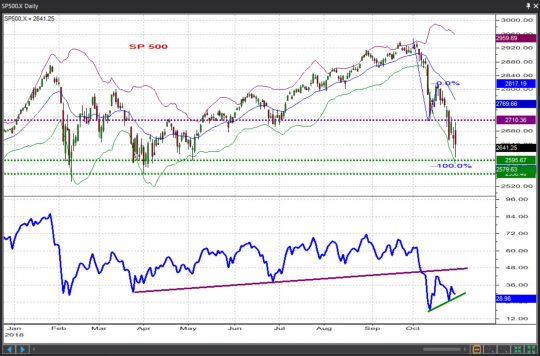
Two nearly equal legs down from above 2900, the proximity of the previous 2018 corrective lows and the current momentum divergence are all technical elements conducive to a short-term low. Pushes above 2680 – 2710 are badly required to breath confidence in the idea that the SP500 is attempting to stabilize here and begin at least a comeback towards the 2820 level. A continuing / accelerating decline below 2560 / 2595 would be absolutely terrible at the moment and speak in favor of a much larger corrective retreat towards the 2200-230 area.
SP400
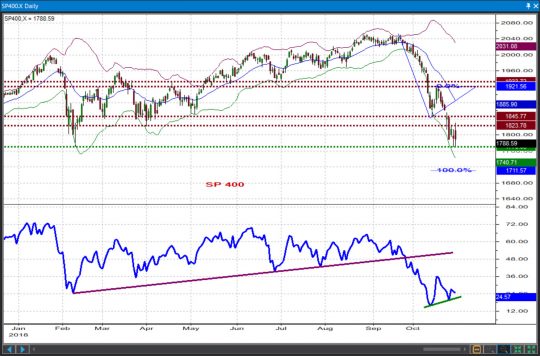
The MidCaps look somewhat hesitant as they flirt with the February lows and they have considerable additional room to reach their own equality relationship at 1711. Pushes above the 1823 – 1846 zone are definitely required to confirm a turn which may otherwise only occur after a peek – and a poke – at the 1710 – 1740 support area. Pushing below 1710 – 1740, while seemingly unlikely at the moment, would be an absolutely terrible development.
SP 600
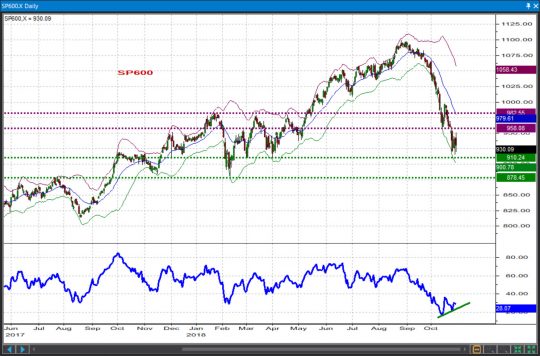
The Small Caps have now reached the upper-end of their short-term support zone at 910. Clearing resistance above 958 / 980-982 would mitigate some of the immediate downside risk and indicate a rebound was already unfolding. Beware the distinct possibility of a more thorough / complete wash out into the 878 and then 825 areas before a more lasting low forms while we trade below 958.
INDU
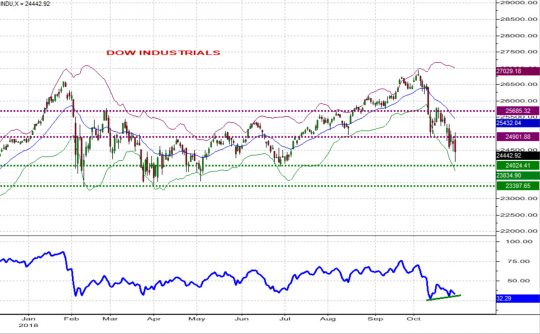
Progressively more important supports at 24,024 and then 23,400 are much closer to the market than they were 2-3 weeks ago and absent a push back above 24,900 / 25,100 we will proceed for a more thorough test of those levels before we establish a stronger low. The situation will become rather complicated below 23,400. We will reassess the picture if that were to happen. Together with the MidCaps the INDU seems to be the index that will have some of the hardest times coping with an eventual push below the 2018 lows.
TRAN
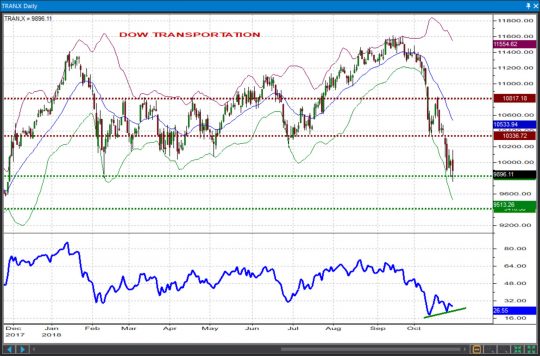
The trannies had a good kick in the nuts here over the past month but are now flirting with fair structural support. If 9,890 won’t do it, then we may take a closer look at the 9,500-9,600 area at which point a rebound will very likely begin. Pushes above 10,180 / 10337 would be initial evidence that a turn was indeed in the making. We’ll stand aside below 9,500 and reassess.
UTIL
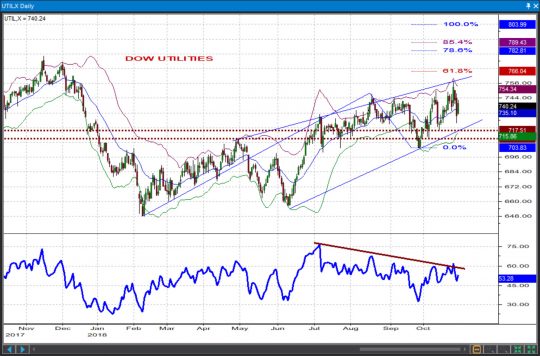
For all their defensiveness the Dow Utilities could only chop higher in a rather bearish rising wedge that develops on a clear backdrop of diverging momentum. We’re expecting the Utilities to remain relatively well bid while they trade above 717 but big picture we’re also expecting them to continue to struggle near the fibo resistances of 766 / 783-789.
NASDAQ 100
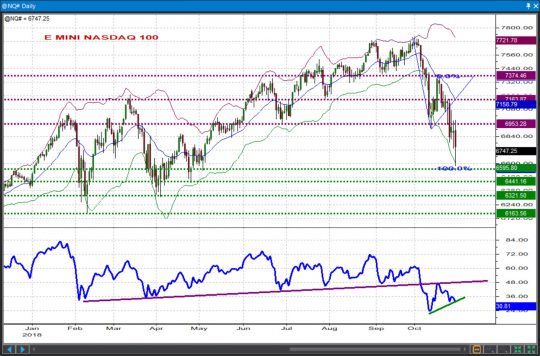
Behavior in Nasdaq 100 is one thing that has us wondering how strong Monday’s low really was. Typically the OTC index would completely lose its mind near a short-term turning point and in our case that didn’t quite happen. The NDX has approached the equality projection at the 6,596 area but it remained almost 200 points above the previous triangle terminus point at 6,440. Be it as it may, pushes above 6,840 / 6,953 would qualify as initial evidence that some sort of bottom was forming though without a rally beyond those areas we cannot rule out at this point further losses into 6,440 / 6,320 before a stronger low forms.
Trading In a High Volatility Environment
First off, thank you for your patience as I have made my way back to the mainland and back to an internet connection that doesn’t remind me of late 90s dialup. While vacation is always nice, I am happy to be home and will be back in full swing Wednesday morning.
Since our last update, volatility has been on the upswing making the purchase of option premium prohibitively expensive. My general rule of thumb for the purchase of option premium is a VIX at or below 20. Anything above this level and you are paying too much for an asset that is designed to go to zero. That said, I would strongly recommend the purchase of options be used sparingly, especially anything out of the money. Deep in the money calls can still work as a stock replacement strategy. Of course other more sophisticated option strategies are available to us as well, but in my experience risking 5 to make 1 or 2 was never a strategy I was keen on. I would rather use ITM options (calls or puts), or begin making a list of stocks that have sold off to the point of attraction. In other words, what are names that stand to rally the most on the other side of the selloff that I can begin building a position in.
In continuance of our theme over the past few weeks, our focus is on less is more, and should we decide to put capital at risk, we only choose perfect or near perfect setups. I highly recommend making a checklist of factors that must be met in order to take a trade. Stringent rules are always prudent in trading, but in times of high volatility they are a must. There are no “close enough” trades in an environment like we find ourselves in today.
The following is a checklist of factors I think will get you started in the right direction. Of these, make certain a minimum of 4 of the 5 are met before putting capital to work:

- The stock is in a long term uptrend. This factor is nonnegotiable.
- Stock exhibiting a bullish momentum divergence. Price is pulling back while RSI is beginning to make higher lows. An example here is GOOGL. Price falls while RSI indicates a bullish momentum divergence.
- Stock is supported immediately lower as shown by high volume nodes in the volume by price study. The GOOGL example above qualifies for this as well. We can see that price has fallen, leaving a long lower shadow right at the one year VPOC level. This indicates bulls are defending lower, fighting to support the stock from falling further.
- Your Overbought / Oversold Indicator of choice is flagging Oversold. The indicator I have been testing as of late which has worked well all year has been Williams %R. I would recommend adding this to your charts. The signal which has worked the best has been when the reading has gone from OS (-80 to -100) and then crossed back above the OS line into “normal territory” which is above -80 up to -20.
- The stock is in a pattern which we know to be bullish. An example would be a falling wedge provided the overall trend is up which we decided was nonnegotiable in Factor #1.
As you go through stocks this week, run through this checklist making certain Factor #1 is met in addition to at least 3 of the 4 other Factors are as well. This will get you in the habit of choosing only the strongest setups, being quick to toss out any which aren’t the best of the best.
Some have asked naturally why we aren’t taking on short positions. This is a valid question and one I plan to address in next week’s letter. I will detail how I go about choosing shorts and the setups to look for to spot a short opportunity should you decide to play stocks to the downside. Suffice as to say for now, I still believe the vast majority of the opportunity lies to the upside but it is important to arm ourselves with new weapons we can utilize in new market environments.
In closing, some of you are aware that my partner Marius went to great trouble to get a new technology out where we can now do stock alerts in real time. We will begin using this immediately instead of just having picks over the weekend. This will allow us more flexibility in sending out opportunities in real time which is better for us and you. So instead of 5 or 10 top 10 picks over the weekend, we will send out real time alerts via email. Look for those to begin tomorrow and Thursday. As with any new technology, we may run into glitches here and there although I think Marius has those worked out. We thank you for your patience as always and look forward to continuing to improve the user experience.
Trent Smalley, CMT
[/vc_column_text][/vc_column][/vc_row]

