[vc_row el_id=”COMMENTARY”][vc_column][vc_column_text]
ANNOUNCEMENT:::::::::::::::::::::::
We are preparing the transition to a better stock alerts service, separated from our weekly newsletter. Please make sure you enable the [email protected] e-mail address through your spam filter(s) so the alerts can reach you by email when they are triggered. The portal we’ve built will enable us to trigger alerts not only on Sundays but also during the week, which we are sure you will appreciate in a high volatility environment.
Accident already in the making or final growth leg to come ?
I have explained in the previous updates why I am a big fan of the Dow Theory and why I view it as a remarkably powerful methodology to decipher market action. Timing is now right to have a word about the value and power of the one piece of technical work that is directly derived from the Dow Theory, i.e. the Elliott Wave Principle.
The Wave Principle is arguably one of the most controversial market theories proposed to date. Many people find it subjective, difficult to apply and at times not very reliable. Arguably, lack of success with the Wave Principle is just like air crashes, it is more a case of the pilot doing the wrong things at the wrong time rather than the aircraft actually going through catastrophic mechanical failure. When you rationalize your feelings through counts you will end up being as good as rationalizing your feelings through the state of market fundamentals. In doing so you only deem yourself to be an Elliott practitioner whereas in essence you harbor as much of the herding mentality as the average Joe involved in this “game”.
If I am to summarize what makes the Wave Principle both unique and very useful I will say it provides detailed PERSPECTIVE on market trends. It is one thing to say the trend is UP and another thing to say the trend is up for a week, a month, a year or a decade because different stances should be adopted in any one case versus the other. In addition, it is one thing to say the trend is UP, as part of a larger, more significant uptrend – in which case you can sit on the position; or the trend is UP but it develops only as a countertrend move in a larger decline – in which case you don’t want to be that stubborn holding longs when short-term uptrends begin to break down.
What I’ve just mentioned is great but where the Wave Principle really and truly excels is with the concept of wave personalities. This provides a unified approach to frame market technicals and market fundamentals to understand where we may be in a full market cycle. It also alerts the analyst as to what can and, at times equally important, what cannot happen under certain interpretations. So I am not going to take you through the entire 5 up / 3 down philosophy proposed under the Wave Principle because it would be too long, but instead I will talk a bit about Wave Personalities, especially as it relates to the current picture in the stock market. The question to answer is this: we know stars are lining up for a major decline but has a major peak formed or is a final run yet to come? In other words, are we in the early stages of a major wave A down or are we somewhere near the end of a wave 4 correction?
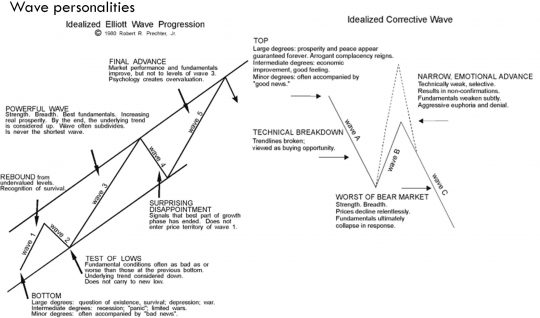
The idealized Elliott Wave diagrams above give us an opportunity to build a check list. The questions to answer are:
- Is the top of early 2018 the peak of a 3rd wave?
- Is the 2018 pullback within the normal parameters of a 4th wave?
- Does the move to a new print high in September count best as a 5th or B wave?
- Does the October plunge feel like a C wave or more like an initial crackdown in the previous uptrend?
- Is there a precedent in history we could look at to understand the current situation?
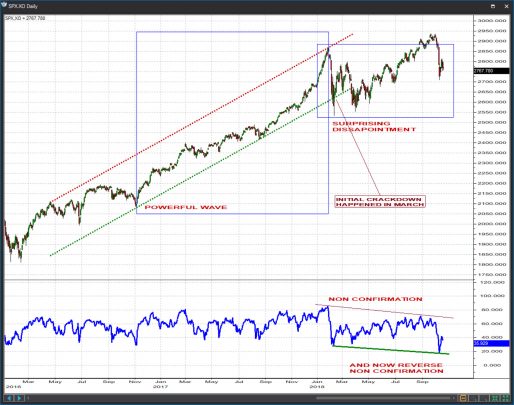
We will use the S&P 500 Index to answer these questions one by one.
- Is the top of early 2018 the peak of a 3rd wave?
Yes the top of early 2018 counts best as the end of an internal 3rd wave in a larger 5 wave structure. This leg up extended, achieved peak upside momentum, was broad based and had back winds from very supportive fundamentals. If you remember back in January when we peaked, very few people could imagine even a 1% correction would ever take place anytime soon.
- Is the 2018 pullback within the normal parameters of a 4th wave?
Yes it is. Fibonacci and structural supports held well to date and the form of the retreat is clearly countertrend, with many overlapping waves and an apparent difficulty to make downside progress. In terms of fundamentals, it has the touch and feel of “surprising disappointment” inflicted to ever rallying prices, which have now cooled off as the cycle of rising interest rates proceeded to the next stage.
- Does the move to a new print high in September count best as a 5th or B wave?
This is the million dollar question and if you put a gun to my head I would say that in the S&P 500 it was probably a B wave. In the S&P 600 and S&P 400 it has likely been a 5th wave. For starters it was very selective, with large and mega-cap indices even failing to make new print highs while mid and small cap indices carried deep into new high territory. As a subscriber well put it, everybody was bulled up and looking for the next rosy thing to happen right before they got hit. Fundamentals were OK ish but a subtly weakening tone / decreasing positive momentum could have been inferred. A 5th wave would have normally brought nothing but fireworks both in terms of economic news and accompanying market psychology. It is difficult to interpret the 2018 situation in those terms.
- Does the October plunge feel like a C wave or more like an initial crackdown in the previous uptrend?
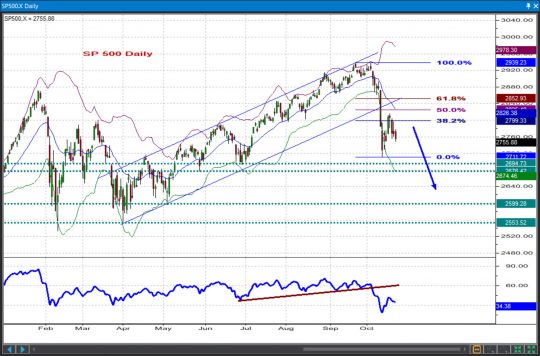
This is more of a C wave decline for two very simple reasons. First off, the initial technical crackdown in the larger uptrend occurred in February. Secondly, a wave A retreat is a more sluggish affair reflecting overall market indecision and some sort of a gradual distribution behavior. A wave C collapse is news and fundamentals driven and it is also sharp and technically strong. In January we dropped from 2850 to 2530 – or 11.3% – and we didn’t even approach oversold. In October we dropped from 2940 to 2710 – or 7.8% – and we actually beat the January momentum reading by a big margin. If anything, the situation of momentum non-confirmation at the September peak is now being followed by a potential reverse non-confirmation during October. Prices would have to quickly drop below 2530 for the reverse non-confirmation setup to be dismissed. As it stands now betting on that seems to be a stretch.
- Is there a precedent in history we could look at to understand the current situation?
In our case it may be premature to make that call but in principle there is. Situations of so-called “running corrections” can be seen in COMEX Copper in 2004-2006 and in Nasdaq in 1998-1999. Do not infer equally wild runs could ensue and just understand conceptually that as long as we trade above this year’s lows we could conceivably interpret the 4th wave pullback is still in progress, which in turn means the 5th wave rally is yet to come.
BOTTOM LINE:
In finding out whether our thing here will be a still unfolding wave 4 from which we erupt higher one last time in wave 5; or is an already unfolding major correction that ensues upon the termination of a shorter-than-usual wave 5 we will have to remain as disciplined and as objective as we can. Clearly, the short-term is dominated by a significant downside risk and to mitigate it markets will have to rise above the October peak, something which appears rather unlikely at the moment. But as we further digest elections and interest rate rises and everything else a final advancing leg can only be dismissed if we collapse through the February – April lows. We may very well retest them but as it stands now I do not have enough data to claim we will break them, indeed it is quite likely we hold them for now.
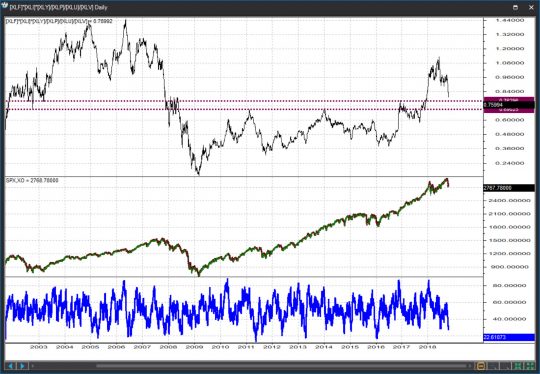
To summarize it all, I propose you this approach. If we treat the Financials, Consumer Discretionary and Industrials groups as growth oriented; and if we treat the Staples, Utilities and Healthcare as defensive oriented, then the ratio of (Financials*Discretionary*Industrials)/(Staples*Utilities*Healthcare) should remain in an uptrend as long as the market remains in an uptrend. By extension when the ratio breaks down the market will be at risk of breaking down itself. Right now the ratio is suggesting a significant pullback is in progress but has yet to deliver the clear-cut signals for a significant crackdown. It is true that the signal can arrive anytime soon in this environment but all I am saying is, it has NOT happened yet. So the strategy for now will be to shield ourselves from short-term risks while remaining open minded and potentially giving the larger bull trend the benefit of the doubt until it will have given “definite signs that it has reversed”……..
UPDATE MONDAY NIGHT ::::: OCT 22ND 09:20 PM EST
PATTERN ANALYSIS
S&P 500 Large Cap
The SPX has significant difficulty rebounding after that vicious early October decline, sign that we’re not out of the woods yet. Expect prices to run into serious trouble no later than 2835-2853 and then slide through 2712 / 2676-2695 en route 2600-2620. We’ll adopt a neutral stance above 2853.
S&P 400 Mid Cap
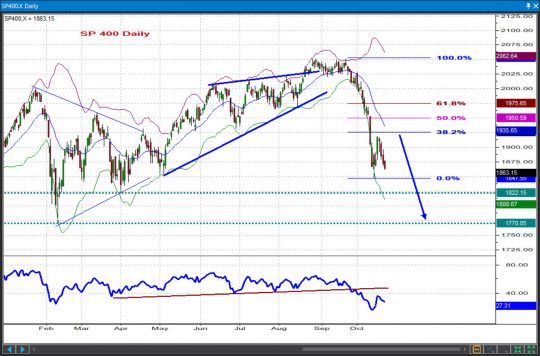
We’re allowing for further retests of the 1936 / 1951 / 1976 fibo resistances while also counting on them to cap any short-term rebound. The mid caps remain pressured to retrace all the way back to the bottom of the previous triangle consolidation at 1822 / 1770.
S&P 600 Small Cap
Small Caps continue to struggle here. Stiff MA, fibo and structural resistance is located at 1012-1029 and we expect all and any rebounds to be repelled up there as the SML continues its journey to the 2018 lows at 911 / 881.
Dow Industrials
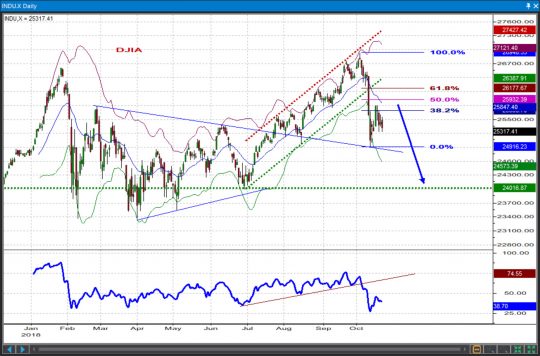
Allowing for further corrective rebounds towards 25,932 / 26,178 the DJIA should ultimately return below the 24,916 level and achieve a full retracement into the July lows at 24,017.
Nasdaq 100
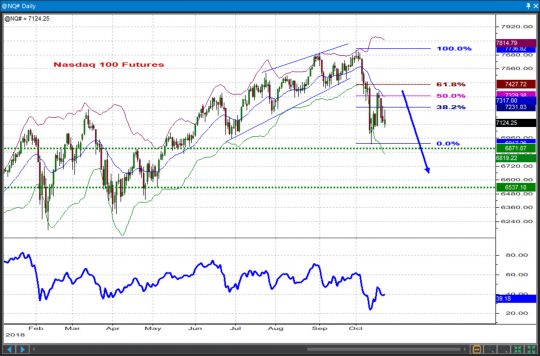
Bounces at this stage should be corrective in nature, should stall around 7330 – 7430 based on the NQ continuation contract and should be followed by fresh weakness below 6871 and towards 6750 / 6540.
 [/vc_column_text][/vc_column][/vc_row][vc_row el_id=”STOCK PICKS”][vc_column][vc_column_text]
Weekly Stock Picks
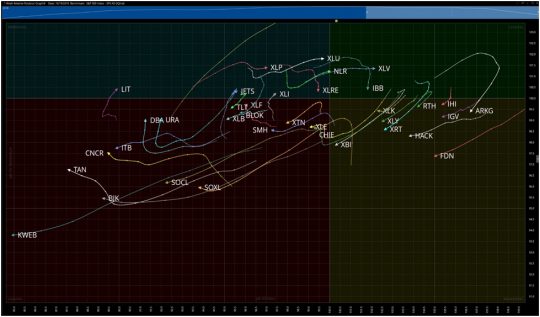
Keeping in line with our theme of “less is more” during a volatile time in the U.S. Equity Market, we will focus on the Top 5 setups this week. Of interest in the RRG above, are the TAN and CNCR ETFs which are trying to make a turn into the improving quadrant. Put these on your watchlists in the coming week and watch for relative strength, especially on days where the overall market may be weak. In terms of the five setups, I recommend short term trades and booking gains as you have them. In volatile markets stocks become more correlated, moving in lockstep moreso than in less volatile periods. For this reason you will see this week the focus in on intraday charts.
AAPL
| DIRECTION | BUY ZONE | SELL ZONE | RISK/REWARD | VEHICLE |
| UP | 218-220 | 225-227 | -1/6 | OPTIONS |
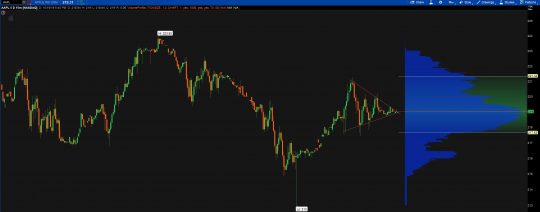
With strong buyers below near the $215 level, AAPL is consolidating right at the VPOC taking into account the last 5 trading sessions. On a percentage basis, AAPL has sold off only slightly from the yearly highs. As price is tightly wound here at the apex of the symmetrical triangle a move will manifest itself early in the week. My bet is on up and I would look at weekly options to play it.
TLRY
| DIRECTION | BUY ZONE | SELL ZONE | RISK/REWARD | VEHICLE |
| UP | 140-145 | 160-165 | -5/15 | OPTIONS |
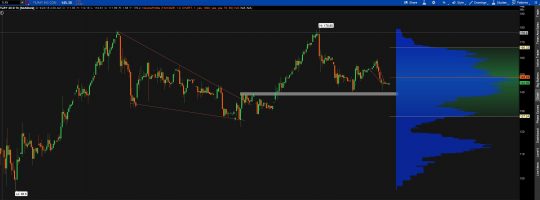
The strength of the cannabis stocks all throughout the sell off over the past few weeks cannot be overemphasized. For a blossoming industry fraught with risk, the majority of names both exchange listed and OTC have acted as a safe haven. We have to continue to expect strength in this area until proven otherwise. Intraday, I like the setup in TLRY. After breaking out of a falling wedge pattern, price is coming back into the breakout area which is has done once before and bulls defended. I want to be long above the $140 level and will use options to do so.
HUYA
| DIRECTION | BUY ZONE | SELL ZONE | RISK/REWARD | VEHICLE |
| UP | 21-22 | 32-33 | -1/10 | OPTIONS |
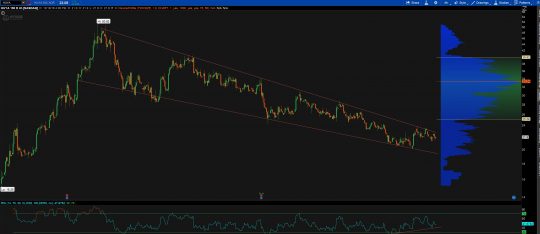
If I could I would label HUYA “any day now.” From the daily time frame to intraday, this falling wedge pattern is matured to the point where something is set to happen. These patterns are bullish provided that the enter the pattern from below, which HUYA has. We can see from the RSI that momentum is on the upswing as well. I am not sure if we will get the chance to buy it as it makes one more low, but if we do I will get long November calls in expectation that the stock works its way higher back into its value area.
AMN
| DIRECTION | BUY ZONE | SELL ZONE | RISK/REWARD | VEHICLE |
| UP | 52-52.50 | 56.50-57 | -.20/4.00 | OPTIONS |
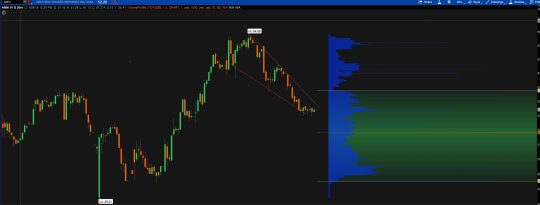
AMN is a falling wedge inside of a falling wedge. Back out to a daily chart and you will see. The $52 price level shows strong support as evidenced by high volume on the volume by price study. Momentum is putting in higher highs and higher lows as well. The options for November are playable here at the $50 or $55 strike level. I am leaning toward $50 as implied volatility is high. They are shown to report on October 31st so factor that into your strategy.
CDAY
| DIRECTION | BUY ZONE | SELL ZONE | RISK/REWARD | VEHICLE |
| UP | 35.75-36.50 | 43-45 | -.50/7.00 | OPTIONS |
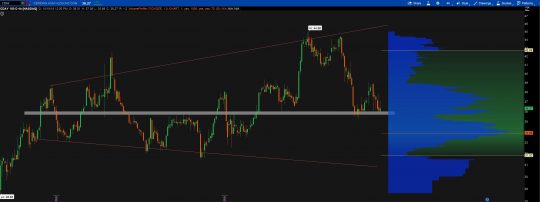
The application software stocks have been sold off particularly hard during the recent market turmoil. I want to get involved in a couple of stocks in this area in preparation of a snapback. I am interested in CDAY due to it being right at the midpoint of the broadening formation. Further, just under the midpoint is the one year VPOC level, both should provide downside support. Play for a move back to the top of the pattern via stock or options of a combination of both.
 [/vc_column_text][/vc_column][/vc_row]

