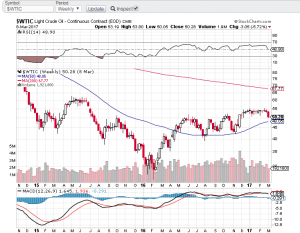
Markets are abuzz this morning with chatter about the recent slump in crude oil prices. /CL surrendered the $50 level with a move down to $48.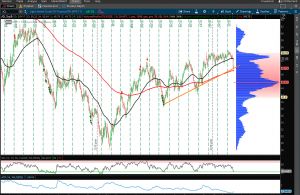
79 before recovering a bit. Data from the U.S. EIA revealed an 8.2 million barrel increase in domestic crude supply for last week which marks the 9th weekly climb in a row. Let’s take a look and try to make sense of some levels from a technical perspective…
This most recent drop broke the 50 day EMA but has so far held the 200 day EMA, which coincides I would argue with the general uptrend.
Taking a look at a weekly chart helps to quiet some of thee noise we see on the lower time frame.
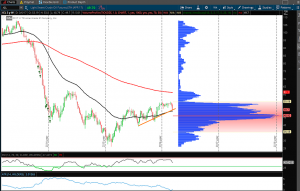
The volume point of control rests at $45.92 which is a significant line in the sand that you would want to see held if you have a long bias. While that is still over $3 away, it is a level to keep in mind.
A similar drop in Crude occurred last year about this same time, but rebounded strongly in April. We can’t depend on the same scenario this year, but again something to keep in mind.
The distance between moving averages serves as a consensus of value area for us. Look for crude to continue to trade between $49 and $52. Watch the weekly candle closely at the close of trade tomorrow for insight into what to expect going into next week… If buyers can defend and leave a long wick on the weekly candle it may serve the bull case well into next week. If not, look for further downside to the $46 to $48 level.