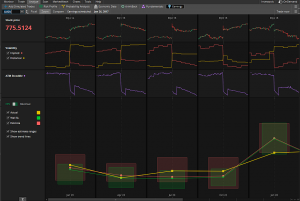
This past weekend, TD Ameritrade released a couple of powerful new tools in its Think or Swim platform. One that I am exceptionally excited about is the new “Earnings Analysis” Tab which you can find under the Analyze drop down. If you are an equity options trader like myself, you are always on the lookout for stocks on the move. Whether that be from a technical setup, news event, product release, etc. you can almost always be certain that stocks around their quarterly earnings release will provide you with a trade setup. An equity is generally more volatile around quarterly earnings so these trades should be entered with caution. I like to look at a few things before considering whether or not to place bet around the earnings report:
1. Is the IV (Implied Volatility) of the Option affordable? Meaning, I like to look for lower IV trades as I won’t have to pay as much for an already inherently risky trade.
2. Is there a favorable technical setup or trend in the stock in question?
3. Is there a Volume “Pocket” in the Volume by Price (Volume Profile) either above (if I buy calls) or below (if I buy puts)?
4. How has the stock performed during its recent earnings releases?
With the Earnings Display in TOS, all of this information is at your fingertips in an easy to use chart that neatly organizes all of the critical data necessary to make a prudent trading decision. Making the tool even more powerful, is that they have drawn upon the data from Estimize, which is another service I have used for years. Their data around earnings estimates is unparalleled in the industry.
With this release, you now have historical and implied price information, volatility, and revenue estimates in a graphical format, all in one place. Thanks to Team TOS for listening to your traders and continuing to impress with powerful tools for traders of all skill levels.

(I am not employed by TD Ameritrade and have purposely left out complex option strategies as it is outside of the scope of this article.)
