From time to time I get asked to take someone through my process of going into the markets in attempt to profit from a trade. The keyword trade here is very important because the process by which an RIA or Mutual Fund manager attempts to make money for his clients is much different than what I do in order to try and profit from short term market moves. It is also differs from what I do when I buy a stock for my long term portfolio. In time I may detail my process by which I choose long term holdings to create a balanced long term investment portfolio, but this post is all about making this month’s paycheck.
The process by which I profit (or not) goes something like this:

Before anything else, I decide what I am willing to risk. This step is often skipped by the novice trader or those who are uninitiated. The rookie puts money to work with dreams of riches in mind. The veteran puts on a trade understanding that this is money he or she may not ever get back. I focus on what I am comfortable losing first, before any thought is given to which stock, option or future I may utilize in order to try and profit. What I am willing to lose is a percentage based on my overall trading account size. While this is going to differ person to person, let’s assume you have a funded trading account of $10,000. You don’t need $10,000 to start by any means but you do need cushion so that when the inevitable losses occur you have ample funds to live to trade another day.
So with my newly funded $10,000 trading account I make a decision upfront what I am okay losing on a trade. In the current market environment, where the VIX is in the teens I choose to trade options the majority of the time due to premium being cheap on average. In other words, the price to buy an option is cheap as implied volatility is low on average. More about this later.
With a $10,000 options account I would be comfortable risking NO MORE than 3% per trade. For the mathematically challenged, $300 out of our available 10k would be the total risk on any one trade. That $300 is in the form of option premium. If we were trading stock, this would be more like 5% per position, but for options which are designed to be more risk more reward, 3% is the absolute max I would personally recommend putting to work on a single position.
So, we have our $300 we are willing to lose ready to deploy. Not to say we are hoping to lose the $300, just the opposite actually. We are hoping to utilize the $300 in order to achieve an out sized gain using a derivative (option) that can reward us handsomely for taking the extra risk. The simple goal in money management is to achieve alpha, or excess return as compared to a benchmark like the S&P 500 Index. Options are one of the very best ways to do this which is why you have to learn to use them.
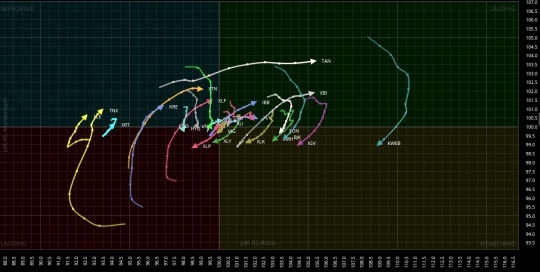
Next, we need to find areas of relative strength in the market. We can do this a number of ways and I have some favorites, but one of the best ways to do this is via a Relative Rotation Graph or RRG. I have written about these time and time again so I won’t go into detail here other than to sing the praises of a newer tool every technical analyst should have in their toolbox. Each weekend a take a look at an RRG that looks like this:


While the math and theory behind RRGs gets quite involved, you can picture yourself looking down on the market from a bird’s eye view, watching sectors and industry groups rotate from outperforming to under performing a benchmark. One of the safest bets when looking to outperform is to identify a group where major fund flows are serving to push stocks in the group higher. We want to start by finding areas in the market where there is strength across the board as opposed to those which are lagging. This helps to tilt the odds in our favor of getting involved with a stock that could end up trading higher simply because other members in its industry group are.
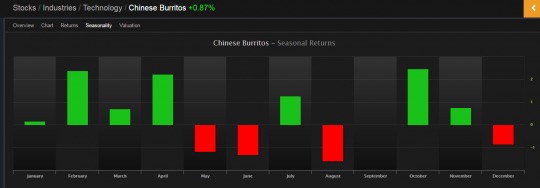
Assuming we have found a group exhibiting relative strength we now get down to choosing a name within that group that gives us the best chance to profit to the greatest degree. Remember, using excessive risk means we have to capitalize and try and reap excess reward, too. Let’s assume that our high level analysis leads us to China Internet Stocks as a group that is exhibiting strength when compared to the rest of the market. We also know that from a seasonality perspective, this group of stocks tends to outperform in the fall. Maybe because money managers coming back from vacation are trying to put money to work in higher beta (often read as riskier) stocks in order to try and make up for a slow summer. Whatever the reason we know from historical analysis that China Internet stocks as a whole are both outperforming and are seasonally strong in October:


Up to this point we have our risk parameters for the trade defined, we have our group that is outperforming on a relative basis, and we are ready to trade… almost. It is at this point where a decision will need to be made on whether we want to go with the ETF itself or pick an individual stock within the group that we think can outperform the majority of its peers. In our example, there is an ETF which is symbol $KWEB that we could trade and be done with it. Or, we can use our stock picking ability to try and find a stock set to beat $KWEB which is almost always my preference. I haven’t spent 12 years staring a charts and data in order to choose an ETF so I’m digging into individual names that in my eyes, are setup to outperform the ETF.
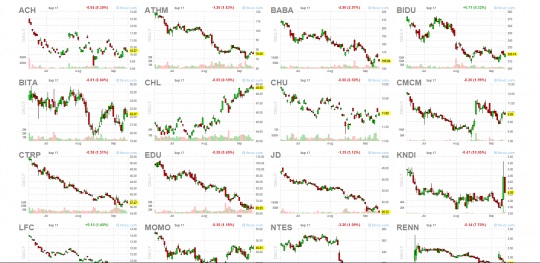
I have several platforms to help me with this but none more powerful than Finviz.com and I highly recommend getting used to using this. From Finviz, I have screens built in with the individual names that are part of the China Internet group. I filter volume so that the names are liquid, and I also filter so that options are available on the stock. Once I have my filters set the screen looks something like this:


There in lies the beauty of Finviz – the thumbnail chart. It allows us to see multiple stocks on the same screen quickly so we don’t have to flip through them one by one. It also helps visually to see them plotted against each other and choose our favorite.
Picking your “horse in the race” at this point is going to vary substantially from trader to trader. Some look for candlestick patterns, some wait for a pullback to a moving average which they view as near term support, some trade breakouts while others try and anticipate breakouts by identifying patterns in charts that are highly probable to lead to violent moves in one direction or another. I would be remiss at this point if I didn’t give credit where credit is due. My friend and trading mentor Jeff Kohler taught me this skill which I have practiced for years. Over 5 years now I have been training my eyes to spot moves before they happen and I can do this fairly regularly now. It does not mean I win every trade or always make money – not even close. It does mean though that I have an eye to spot moves before they happen that will put us in position with proper risk management to profit to a greater degree than the next trader. It means that out of 10 trades, if I am correct 50% of the time I am going to be profitable because my winners will be more profitable than my losers. That is an absolute must when trading a system like this. Your winners must profit to a greater degree than your losers.
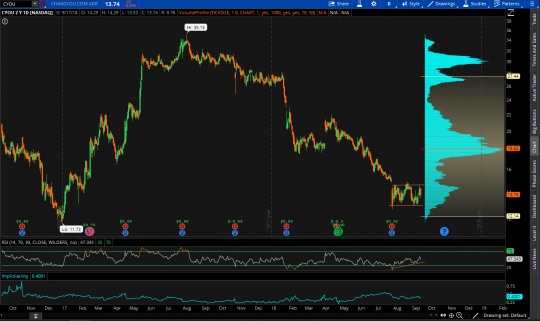
So through levels of my own analysis let’s say I have found my perfect candidate. I choose to trade a stock $CYOU. This is a beaten down stock that for all intents and purposes has been left for dead. It has been in a downtrend for the majority of the year but has recently firmed up perhaps forming a rectangle bottom with a bullish momentum surge as seen by an uptrend in the 14 day RSI. Down here, the utterly frustrated are selling out of the name, taking losses and willing buyers looking for a bottom feeding deal are there to pick up the pieces. That might look something like this:


At the bottom of the chart is the implied volatility indicator which shows us a reading for the price of option premium. It is important as an option buyer that this be as low as possible so we can get more premium for the money. As it stands now, Implied Vol is just fine for us so now we are ready to go over to the option chain on our broker platform to see what is available for purchase.
I don’t want to get into a full option theory discussion here at that is outside of the scope of this article. Full texts have been written about options and if you need help might I suggest a book that will make your head hurt called Option Pricing and Volatility by Sheldon Natenberg. I’ve read it and forgotten most of it at this point but I suggest going through it once. For my style of trading a few things are important when it comes to the available option chain:
- The spread must be reasonable between the bid and ask.
- Implied volatility when purchasing premium has to be low.
- The strikes available must be conducive to price targets we set for the stock.
At this point the novice trader is going to see some far out of the money option premiums and swing for the fences. Bad idea 95% of the time. It is a good practice to look back at the historical chart and see what kind of moves are reasonable for the stock in question within a given time period. Eyeballing it from the chart above, we can see that prices fell from about $17 to $13 from July to August in a fairly swift move lower. In other words a $4 move in 30 days isn’t out of the question. What probably is out of the question is $CYOU going to $25 bucks by October. So guard against buying the way out of the money “lotto tickets” for 2 cents. I often buy the first strike out of the money, or at times two strikes out of the money if I give it more time. Options are a balancing act between your premium, the strike price you choose and the expiry. When one of you figures out the recipe to win every time and choose the perfect expiry and strike let me know. I’ve been at it for a decade and still miss the mark fairly often.
All that is left is clicking the “buy” button and putting that $300 of premium to work at a strike price and expiry that we are comfortable with. There are option pricing calculators out there you can play with to get a feel for how ITM and OTM options differ in price movement. This comes down to your risk appetite and your trading style. If you can’t stomach being wrong, it makes sense to buy deep in the money options and expect small profits. If you could care less if you are right or wrong and just want to make the biggest profits, at the money or just out of the money is your best bet. If you are a degenerate gambler, fraught with debt and driving cars you can’t afford and wearing knock off Rolexes to impress your other dumbshit buddies, buy those way OTM options and see what happens.
The above is a “short hand” version of the approach I take with each and every position I put on. It is impossible to write a single blog about an approach I continue to refine year after year for the better part of a decade but this is the general framework from which all trades are made.
I hope this can help aid in your process and be sure to email me if you have any questions about this approach.
Hope you all had a wonderful weekend.
OC

A gem of an article. You pretty much laid out a trading plan for someone new in this game. Everyone should bookmark this article.