
Among the many technical indicators available to us as market technicians lies one in particular that to this day I have trouble wrapping my mind around. These tools aren’t necessarily difficult to use or interpret, but trying to grasp why these work takes some higher level thinking. I am speaking of the Fibonacci toolset (Extensions, Retracements, Time Series, etc.). I won’t go into an exhaustive overview of them here but if you are interested you can take a look at them more in depth here at this link:
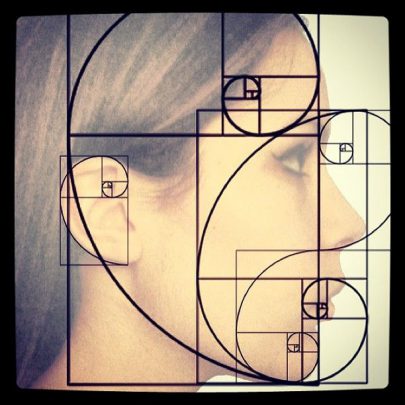
I have mentioned before that the study of markets through the Technical Analysis lens is part art and part science. Never is this more true than when a market participant breaks out his Fibonacci study set. Technical analysis is of course part art and part science butI would argue that this area is more science than art. Fibonacci sequences and ratios are seen throughout nature: architecture, galaxy formations, how leaves grow, and human body proportions.
In the case of capital markets, asset prices respect Fibonacci levels over and over again. I have hundreds of examples saved throughout the years showing this to be the case. Those who live and breathe Elliott Wave Theory would tell you that markets reflect the entirety of human emotion and sentiment and that Fibonacci levels encompass that. This is a lot to comprehend. For the sake of brevity and the shortened attention span of my reader base, I’ll just submit that price respects these levels, and so should we.
While I make use of Fibonacci Extensions and Retracements across multiple timeframes, the majority of my analysis using them is focused on longer term charts. The one in particular I will share with you today is that of probably the most watched market in the world, the S&P 500 Index.
The analysis starts by taking into account the entire selloff in this benchmark index caused by the Financial Crisis of 2008. Back in the fall of 2007, the SPX sat at around 1565. In roughly 5 months, we collapsed to about 670, a swift 60% correction before finding footing below. A visual reminder of what that looked like:
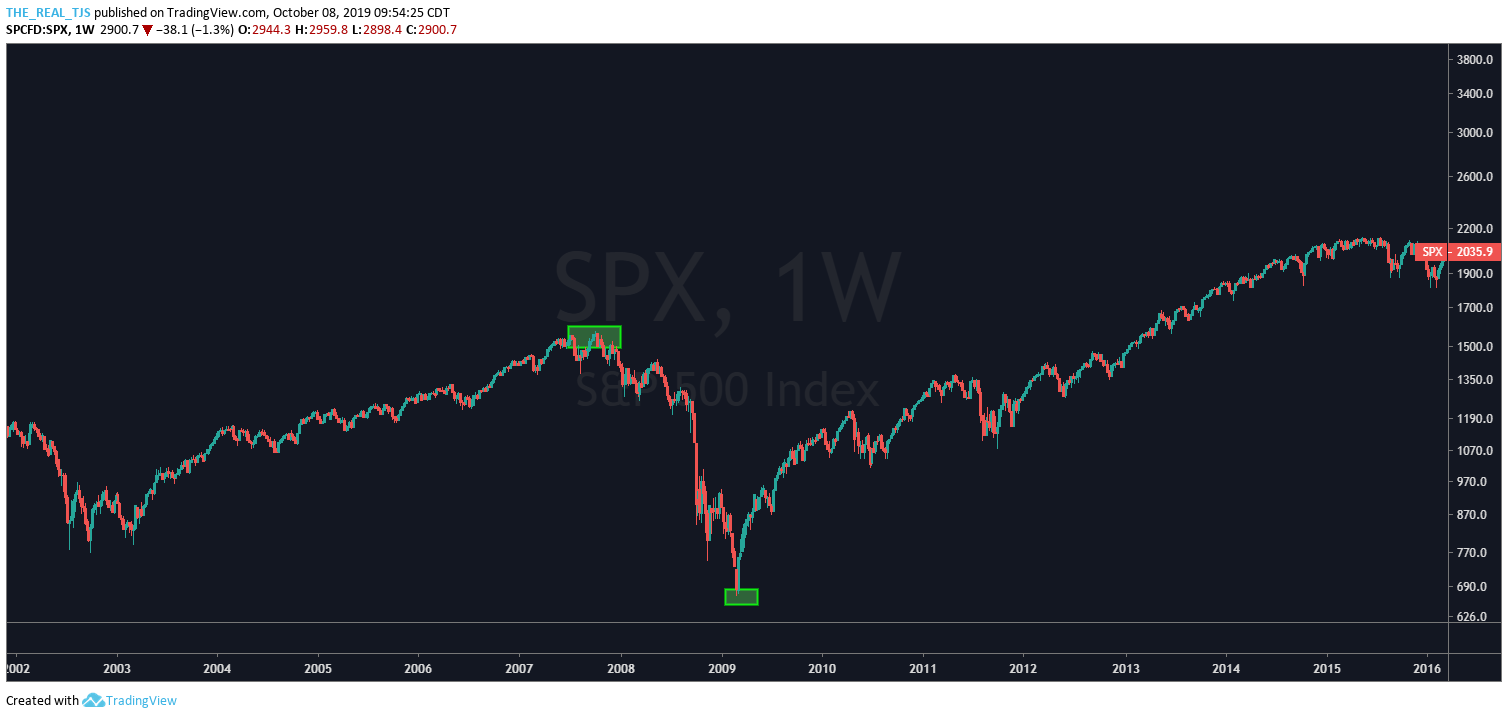
In the ascension of price is where the voodoo of Fibonacci comes into play. The top to bottom collapse shown in the green rectangles above is 100% of the collapse. In other words, that is the entirety of top to bottom in price. Now as price works its way back up again, watch what happens:
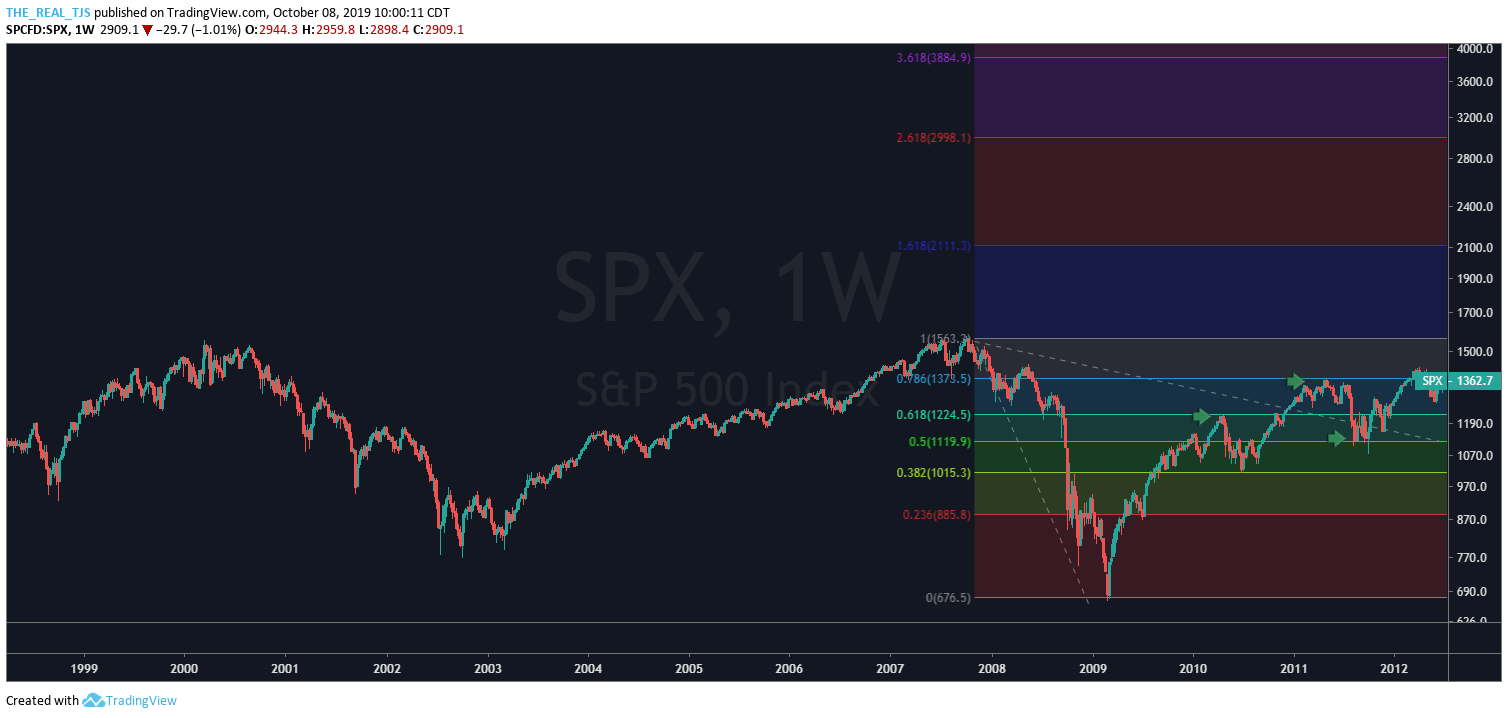
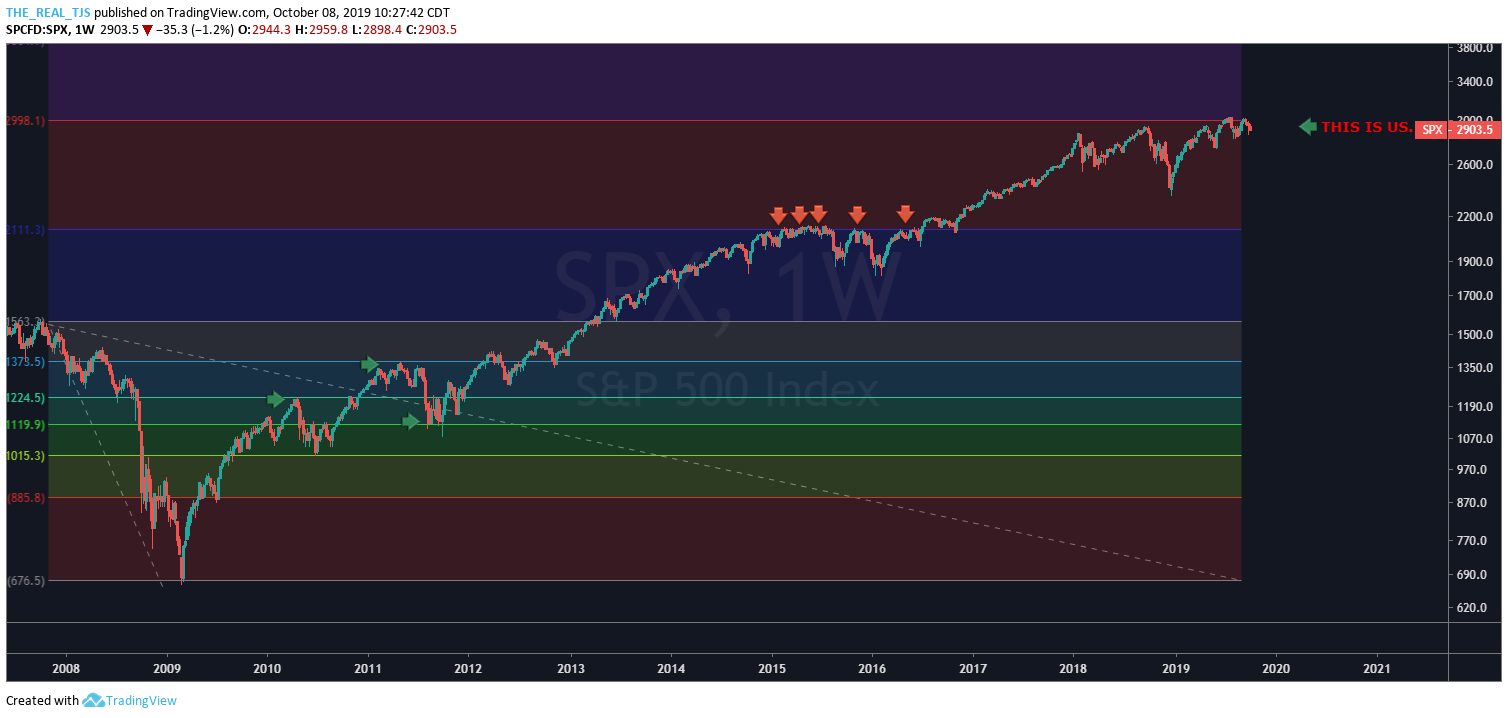
Marked with the green arrows you can see where price starts to respect Fibonacci Ratios as the market regains its footing. First the 0.618 Fib Level was shown to be resistance. This was a retracement of the original major selloff in price and this level at nearly 62% was resistance initially, as price fell back lower. As it fell, another Fibonacci Level was in play, this time price supportive. The 38.2% level served as the spring board to send price higher once more, this time back up to the 78.6% retracement level which you can see was a nuisance for price to work its way though.
But as our great country and its economic engine expanded, price overtook the 78.6% retracement level and moved on, ultimately taking out the previous highs seen before the crisis. Once above the previous highs, no need to throw out the Fibonacci toolkit, we just call the levels Fib Extensions instead of retracements. Whatever you call them, the levels remain what is most important. As price climbed higher, in came a level which we struggled with for some time:
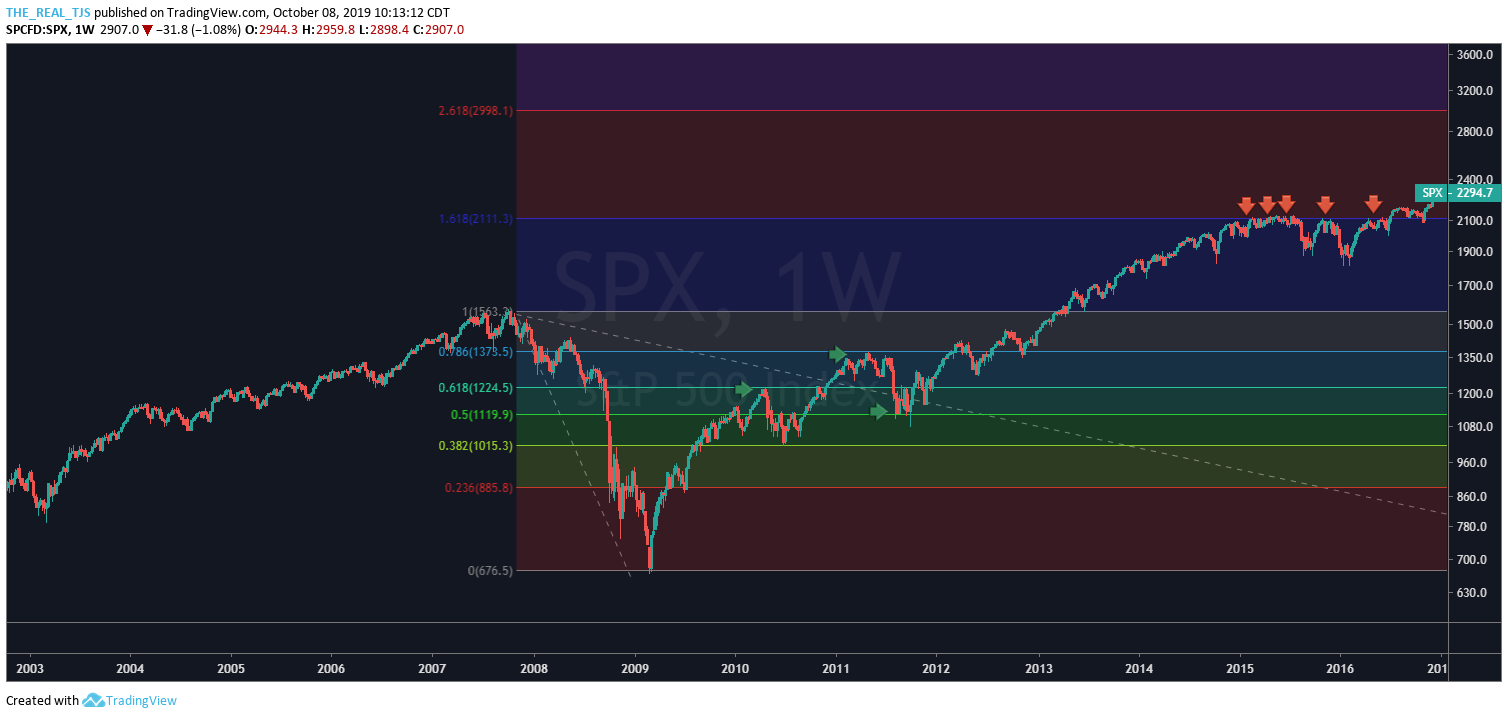
The SPX Index frustrated us all from 2015-2017 as price bumped its head over and over until CTE set in. But that 2100 level? That is the major and most important Fibonacci Extension, 1.618%. Funny how a psychological, round-numbered level coincided with major Fib resistance. But once again, price was able to capture the level and what was resistance became support and price discovered higher once again.
That brings us to present day, where price is once again frustrating market participants both long and short alike. And not for nothing. The day to day news flow, China Tariffs, Inverted yield curves, Brexit, economic slowdowns Globally, etc. etc. etc. kill me. Is it possible that Fibonacci Numbers and ratios, the very same ratios known throughout nature, are dictating or at minimum influencing price discovery?
You tell me…
Trent J. Smalley, CMT