
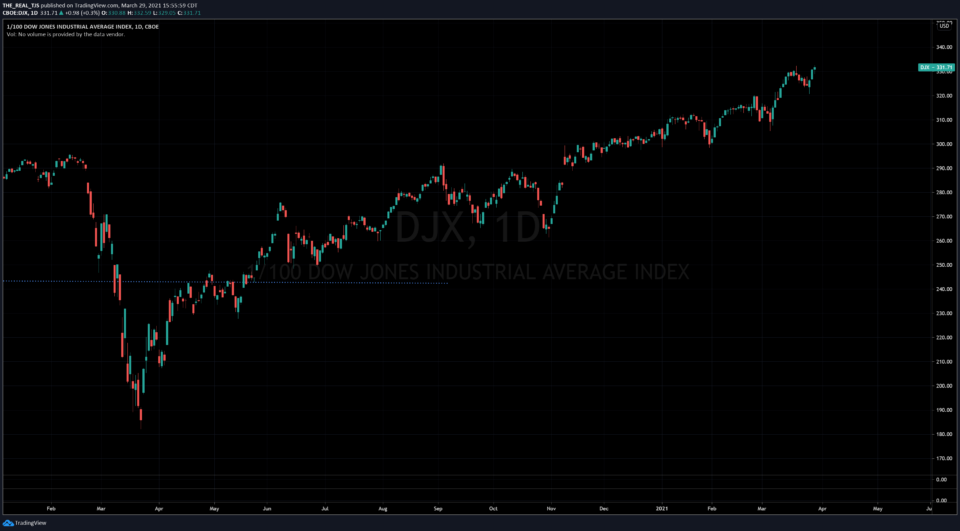
As I write, the Dow Jones Industrial Average has managed to close at another record high year to date. What is going on beneath the surface though, has been telling a different story.
To illustrate my point, let’s do a quick exercise. If you were to take an exam on what drives a stock’s performance over the longer term, and I gave you a cheat sheet to use with a few simple rules they might go something like this:
A. Accelerated EPS growth quarter over quarter and year over year.
B. Return on shareholder equity of 15% or greater.
C. Accelerated sales growth quarter over quarter and year over year.
D. Increasing institutional sponsorship (fund accumulation).
On test day, you sit down armed with the simple cheat sheet rules given above. You open the test booklet and are presented with your first (and only) test question:
- Given the following information, which stock would you rather own only taking into account the information presented in the excerpts to follow?
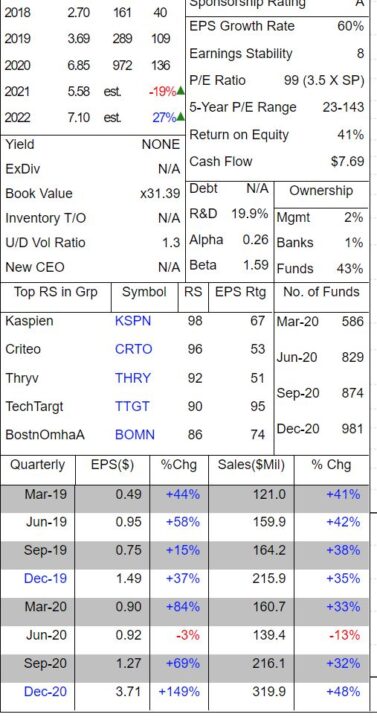
A.
B.
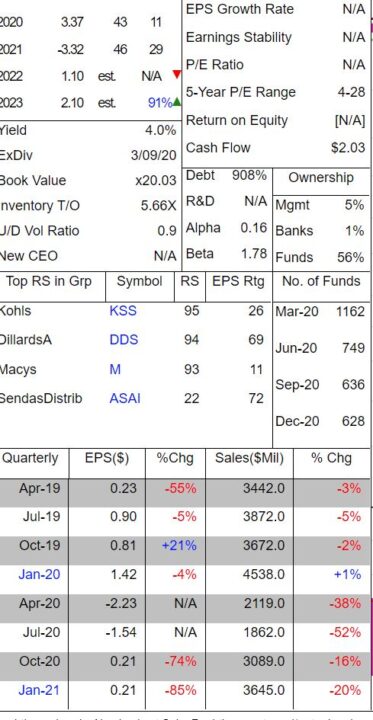
After consulting your cheat sheet you notice that exhibit A seems to satisfy all of the prerequisites for a stock which should see its price increase over a reasonable period of time. It had its best EPS quarter to date, sales growth is present, has an ROE of over 40% and shows an accumulation of funds owning the stock. Exhibit B shows the exact opposite: Sales growth slowing, EPS trending in the wrong direction, ROE just shows “NA” so that can’t be ideal, and its lost nearly 500 funds holding the name.
You circle the answer sheet corresponding to exhibit A and turn in your exam. (Apparently your professor is lazy and only writes tests containing one question, or in this case he knows long blogs don’t go over well). As part of the exam, you also were awarded one share of your chosen stock which was purchased for you at the start of the quarter. But… only if you were correct in forecasting the stock’s rise or fall. No problem right?
The following day, the professor hands back your exam and you have received an A, because your cheat sheet was correct. You’re happy with your grade and become excited because you remembered you also received a share of the “correct” stock when you turned your exam. Much to your surprise, you find out that while your answer was correct on paper, stock A declined nearly 30% YTD while stock B was up nearly 25%.
Stock A:
Stock B:
What went wrong? Was it the pesky “reopening trade” again? Higher rates again? Outflows of growth stocks into value stocks again? Maybe just a simple reversion to the mean as growth which has outperformed value for over a decade gives back some gains.
Whatever the case may be, there are countless examples of “growth” names having a rough start to the year. It’s been the narrative that won’t go away. And if it doesn’t soon, I’m convinced we will have a bigger problem on our hands.
In the practice of “timing the market” which your door to door junior advisor will tell you can’t be done, there are certain conditions to look for. Near term market tops can be forecasted, and we are always watching for them.
William O’Neil in his masterpiece “How to Make Money in Stocks” warns of near term market tops when the following conditions are present:
- 3-5 distribution days in one of the general market indexes over a period of 4 or 5 weeks. As I write both the SPX and NDX are at 6. The market is actually advancing while it comes under distribution. (Dow new all time high again)
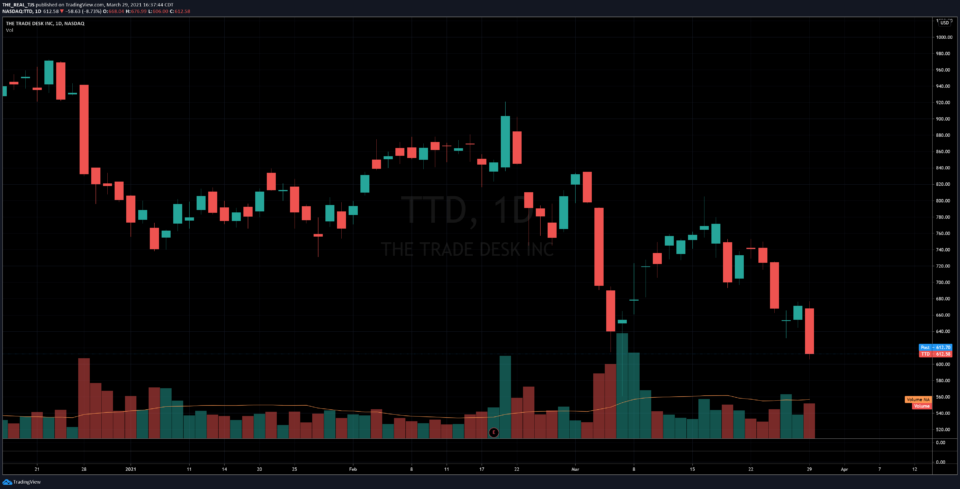
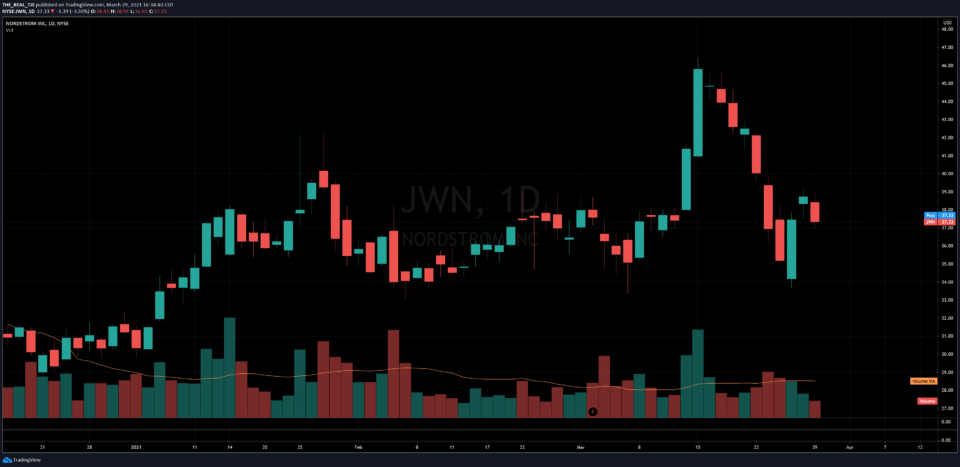
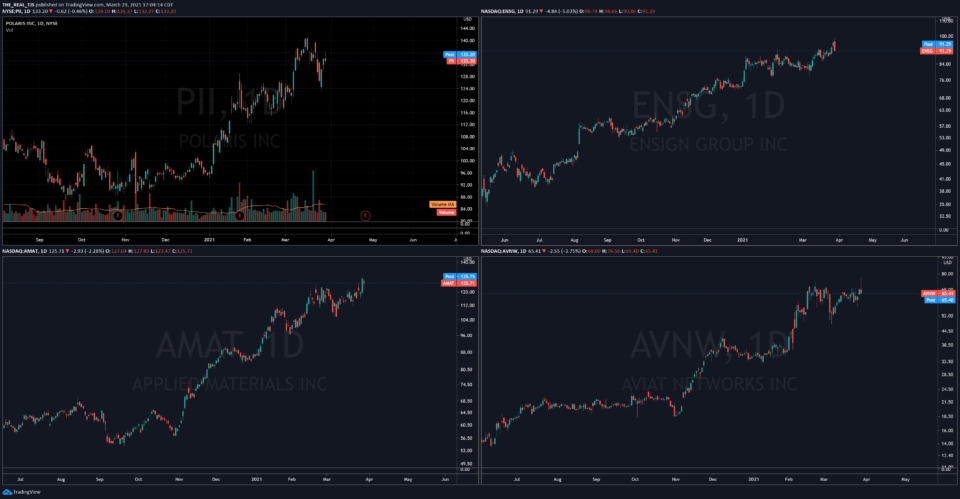
- Former market leaders begin acting abnormally. They give up more than 20-25% of their gains in a short period of time. There has been a lot of this going on…
- Recent stock purchases (especially on new breakouts) turn down and go against you abruptly. Here is a quick look at some recent breakouts which turned lower almost immediately:
4. O’Neil writes and I quote, “If the original market leaders begin to falter, and the lower priced, lower quality more speculative names begin to move watch out. When the old dogs begin to bark, the market might be on its last feeble leg.”
Weak leadership cannot command the market for any longer period of time. When farm machinery, highly speculative names with no earnings, or your trade de jour (NFTs, SPACs, and the like) begin to far outpace those companies growing consistently, my guard is up.
Convinced a top is around the corner? Not yet. Frustrated with the current market action? Most definitely. For the past month I’ve teetered on the brink of super bullish to bearish to bullish again and now… I honestly don’t know where I stand. There are some tell tale signs to be cautionary, but credit is still flowing, and some of the ratio charts I have followed for years don’t show anything out of order, at least yet. Those watching the growth / value trade play out might be watching the following ratio chart. So far it bounced right where it should.
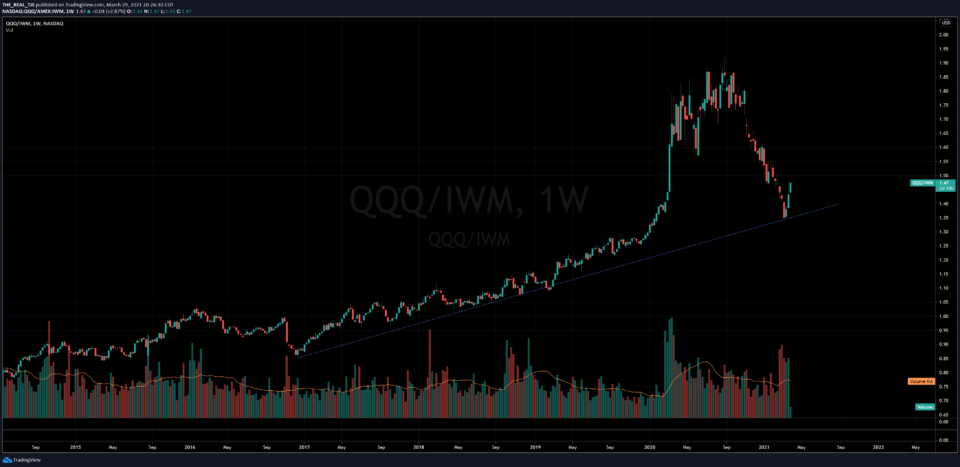
We are watching to see how the end of the quarter shakes out. I’m convinced we are near the precipice of a sharp rebound in “stocks that matter” or the second quarter will be spent raising cash until the market reproves itself. Time will tell.
Stay safe out there.
Trent J. Smalley, CMT
Please remember that past performance may not be indicative of future results. Different types of
investments involve varying degrees of risk, and there can be no assurance that the future performance
of any specific investment, investment strategy, or product made reference to directly or indirectly in this
newsletter (article), will be profitable, equal any corresponding indicated historical performance level(s),
or be suitable for your portfolio. Due to various factors, including changing market conditions, the content
may no longer be reflective of current opinions or positions. Moreover, you should not assume that any
discussion or information contained in this newsletter (article) serves as the receipt of, or as a substitute
for, personalized investment advice from JSPM LLC. To the extent that a reader has any
questions regarding the applicability of any specific issue discussed above to his/her individual situation,
he/she is encouraged to consult with the professional advisor of his/her choosing. A copy of our current
written disclosure statement discussing our advisory services and fees is available for review upon review.