
I have written a couple times about Sentiment Cycles and how they relate to my process in security selection. As a refresher, Justin Mamis in his book “The Nature of Risk” wrote about how human emotion plays out in repeatable patterns. In his book he illustrates the cycle as follows:
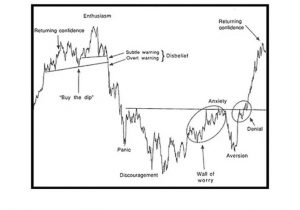
This chart hangs above my desk in the office, at home, and has served as a reminder to always keep in mind where a stock, ETF, or other asset is in relation to its repeatable cycle. It wasn’t until this chart was burned into my mind that I started seeing this in stocks all over the place. In scanning through charts this morning I came across $BITA:
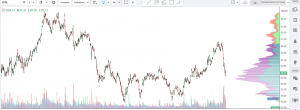
I think even the untrained eye can see this taking shape. Pair that with the capitulatory selling volume right into the point of control, I want to take a long in this right here and now.
It may take some time to play out but the measured move in accordance with the Mamis Cycle would be $45-$48.
Back with more soon.
OC