
I feel like I have been saying that forever, “Oil Will Be A Buy Soon.” Oh, it’s because I have. I have been early (wrong) on this call for the better part of a year now, so position at your own risk.
Commodities and specifically oil, begin to work when we start to see signs of inflation. Here is where the argument usually starts…
“Does inflation cause the price of oil to increase?”
“Duh, everyone knows that.”
“Actually you are wrong, it’s not a cause and effect relationship and hasn’t been consistent over time.”
“Your Mom hasn’t been consistent over time!”
You get the picture. I am going to save you from all that and use a mathematical principal that I am certain you did your best to forget after high school statistics class – if you managed to learn it in the first place.
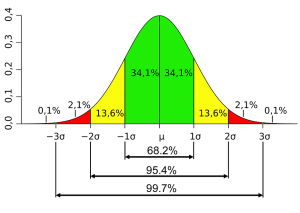
The Gaussian (Normal) Curve
Terms like mean, median, standard deviation, p-values, Null Hypotheses, moments of standard normal probability, Chi Squares… I can only assume they conjure up thoughts of when you thought long and hard about changing your college major to Humanities, so I am going to make this real simple for you.
That green shaded area above? It represents approximately 68% of all values around the average.
Add the yellow shaded areas above on both sides to the green area and you have approximately 95% of all values around the average.
Finally, add those little red areas on the outsides to the green + yellow areas and we have approx 99% of all values around the mean accounted for.
In other words the majority of values are on average… average. Then there are some values that fall further away from those in the middle 68%, and fewer even that lie furthest away from the middle. Those are the rare cases. Those are the ones that don’t happen very often. Those are the students you hated in your college classes because they aced the tests and raised the class average, while you sat around in the back drinking Mountain Dew through a Twizzler straw wondering if you were smart enough for college.
Those cases that fall far away from our measure of central tendency, tend to revert back towards the mean. In trading… Mean Reversion. Once we stretch a rubber band far enough, it tends to snap back.
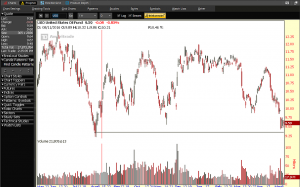
Take a look at a daily chart of $USO (United States Oil Fund) taking into account the price action so far in 2017:
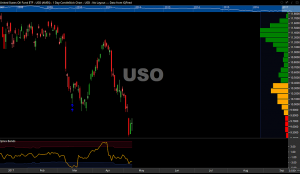
All I have done here is take that Normal Curve you just (re)learned above and stuck it on the right side of the chart. I colored it the same so you can see where price is relative to a normal distribution. Green = Normal (One standard deviation), Yellow = a little less normal (two standard deviations), and Red = Rare (3rd standard deviation).
Oil, as seen by the $USO Fund is in that red level. What some may call a Three Sigma Event. It’s not incredibly rare taking into account 5 months of price action, but then again it isn’t that common either. Prices can stay in this 3rd deviation level for a period of time, but they will revert back toward a more central level of price. One that isn’t as “rare” if you will.
From a more subjective perspective, what we just saw “feels” (if I may) a bit like some capitulatory selling exhaustion. $USO is taking shape for a value buyer to step in and take a shot on the long side. I would much rather be long here, than s
hort if I had to take a side.
What do you guys think?
Email [email protected]