
The accountants at Omahacharts Enterprises have closed the books on June’s P&L and the results are in. Minimum standards were not met, money was lost in both short and long term accounts and the locals are restless. A combination of being caught offside with risk pressed led to a lackluster month where it appears the head trader and portfolio manager was “out to lunch.”
It happens. Certainly not the first time and it won’t be the last. It is important to learn as much as you can from months where things don’t go as expected. Go back, analyze the positions you took, where you put them on, technical patterns, implied volatility levels, market events, etc. that all contributed to you joining the ranks of many a failed trader. Take the bumps and bruises in stride and forget them quickly for new opportunity is on the horizon. Or do what most people do and blame others, act like an entitled fool and shake your fist at the sky, threatening the market Gods like a madman. I’ve done both and it turns out the latter never got me anywhere.
On to July…
I like to see the first session of a month play out to try and get a feel for what industries may be getting bought from the outset. There is obvious strength is some old familiar biotech names today and a couple in the system software areas.
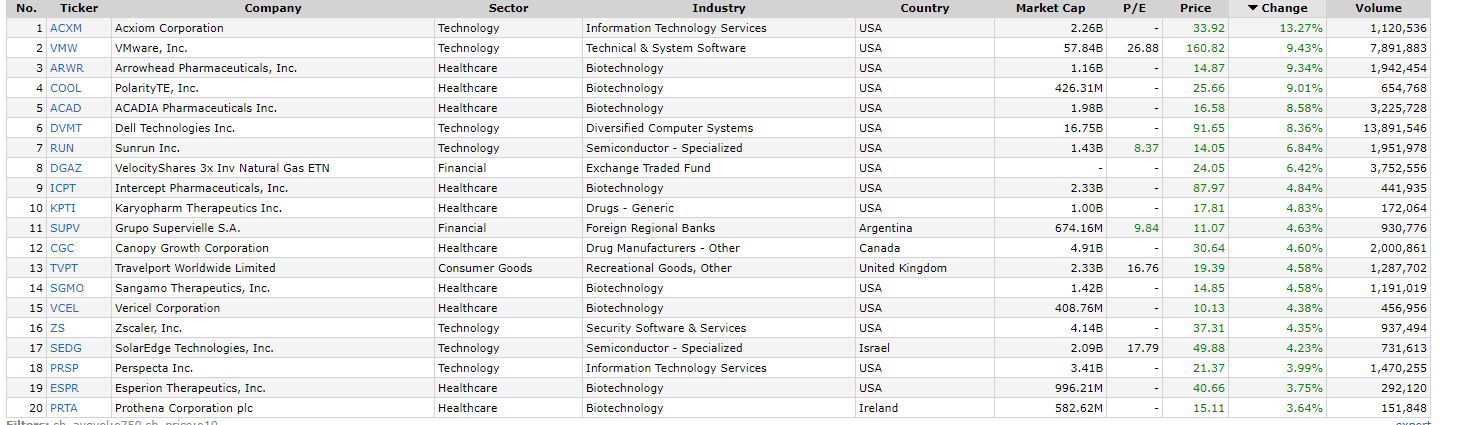
These will be two industry groups I will be keeping an eye on in the early going in July to watch for continued relative strength.
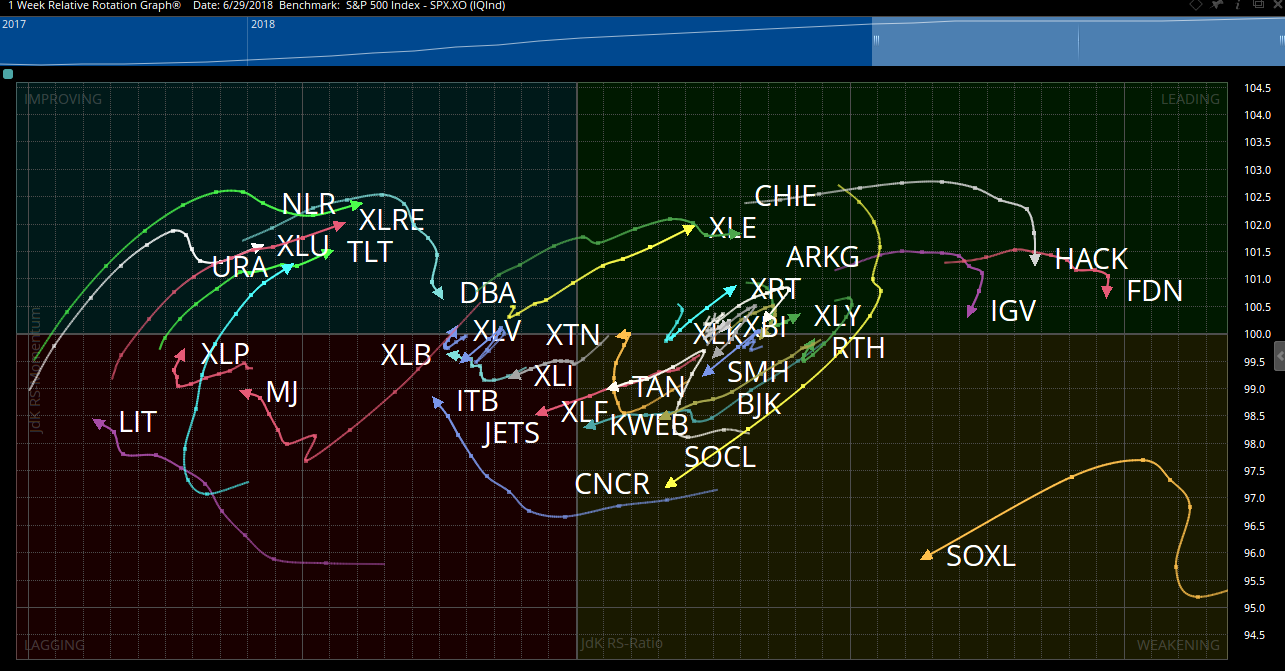
Each week I watch industries of interest and their relative strength or weakness as compared with a benchmark such as the S&P 500. The best way to do this is through a Relative Rotation Graph developed by my friend Julius de Kempenaer and one of the most powerful tools available to see sector rotation and the flow of money graphically. Some obvious (or not) notes from the RRG week ending June 29 is the relative strength in Energy, the $ITB making a move and $NLR on a clear path to the Leading Quadrant.
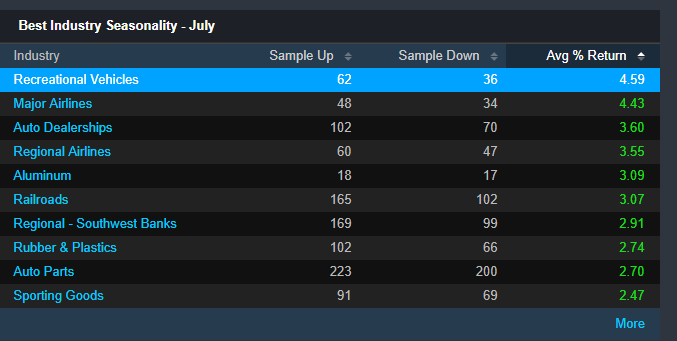
For the fans of seasonality studies, I build a screen at the start of each month to scan for industry strength for the current month based on historical seasonality. Some areas to investigate are as follows: Not the strength in airlines, aluminum, and the railroads.
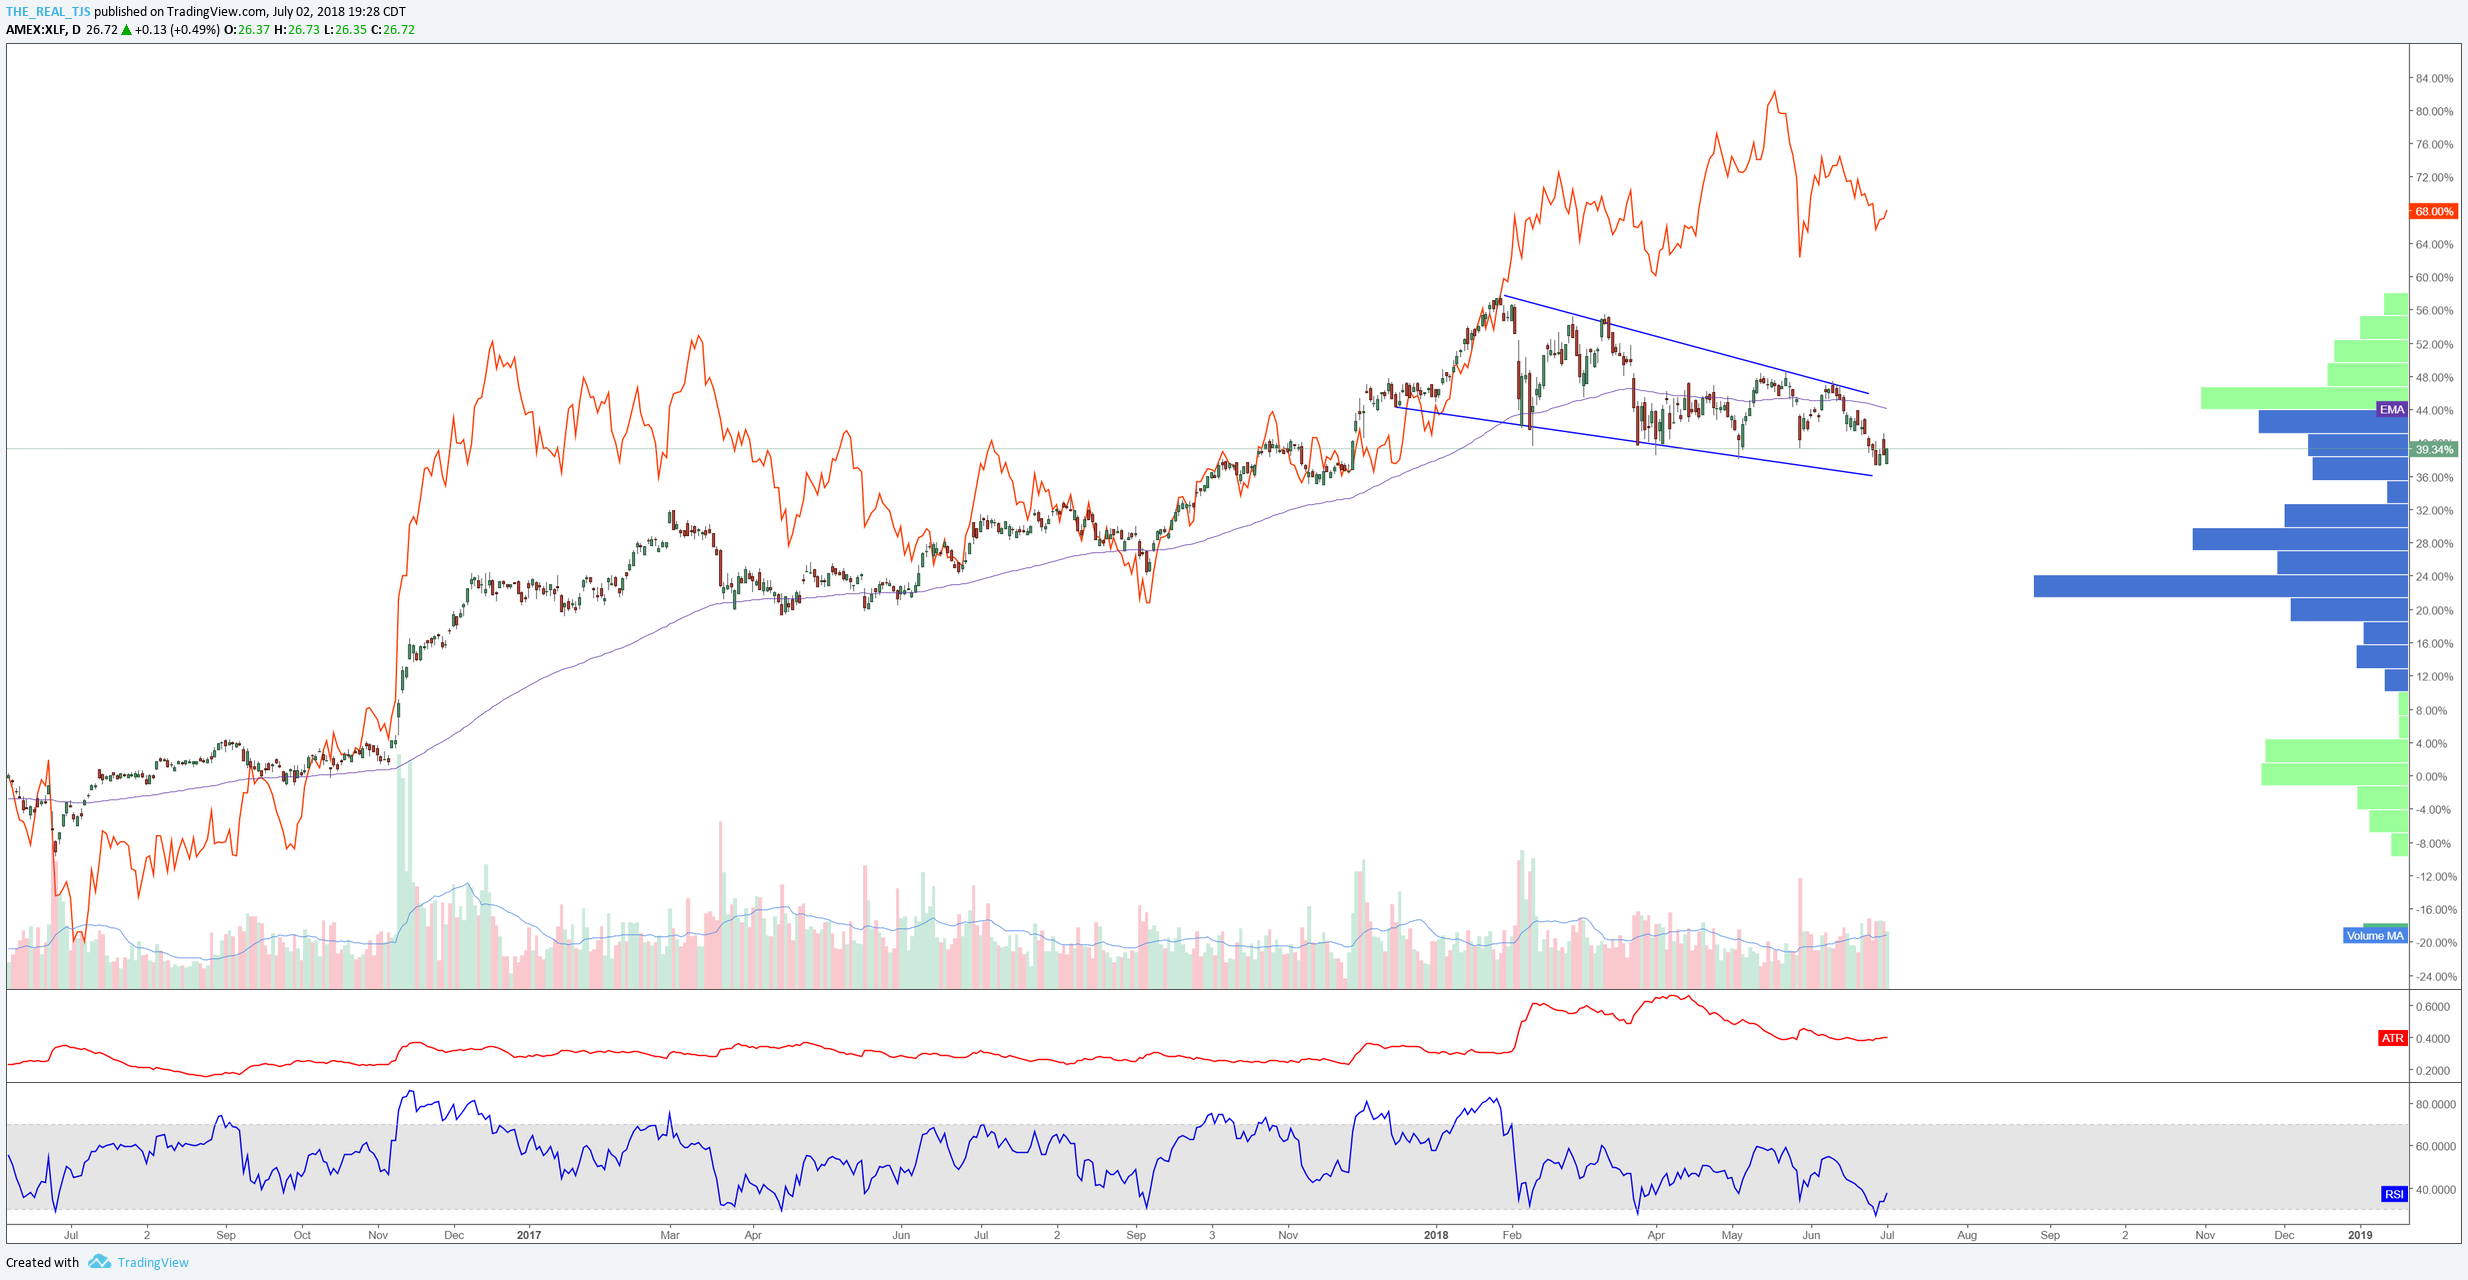
The financial sector is an area of interest here as well. Take a look at a comparison chart of the XLF and the TNX 10 year note. The TNX and XLF have traded similarly with the TNX often leading the XLF. The two instruments have diverged as of late but I expect the financials to catch up and continue higher. I have options positions in $GS, $BAC, $MS, $JPM and a couple smaller banks as well.
While the first day of July opened lower, the US equities closed green with risk assets leading the charge. I think this bodes well for a move higher in the early going in July. Watch for strength in biotech, financials, energy names.
What are you guys buying heading into July?
OC