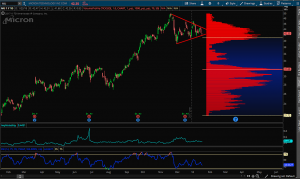
Before it moves I need to show you something. Look at this beautiful chart of Micron, $MU:

This is everything I want in a chart. Consolidation pattern after an uptrend. Price comes down to touch the lower edge of the symmetrical triangle, leaves a long lower shadow signalling buyers defending below.
Watch for a break out back up to test $50.
I am in February calls of the $45th strike.
Back with more soon.
Thank God it’s Monday.
OC
