
The first three-day weekend of 2022 is upon us, with both the equities and bond markets closed on Monday for Martin Luther King Jr. Day. In past years over these long weekends, I have put out research notes that I hope serve to lay out a roadmap for where markets may be headed, and what we are keeping an eye on in the near to mid term.
It should go without saying that no one is capable of forecasting with any degree of accuracy what the future holds next week or next month. That includes myself. If someone tells you they can, it is your job to ignore them and dismiss their prognostications straight away. What I am very capable of is using history as a guide, forecasting probablities of different outcomes over the longer term, and ensuring that investor capital is protected during volatile market environments. What follows is an open dialogue of my research and thinking as we prepare to take on 2022.
Inflation, its impact on markets and your money
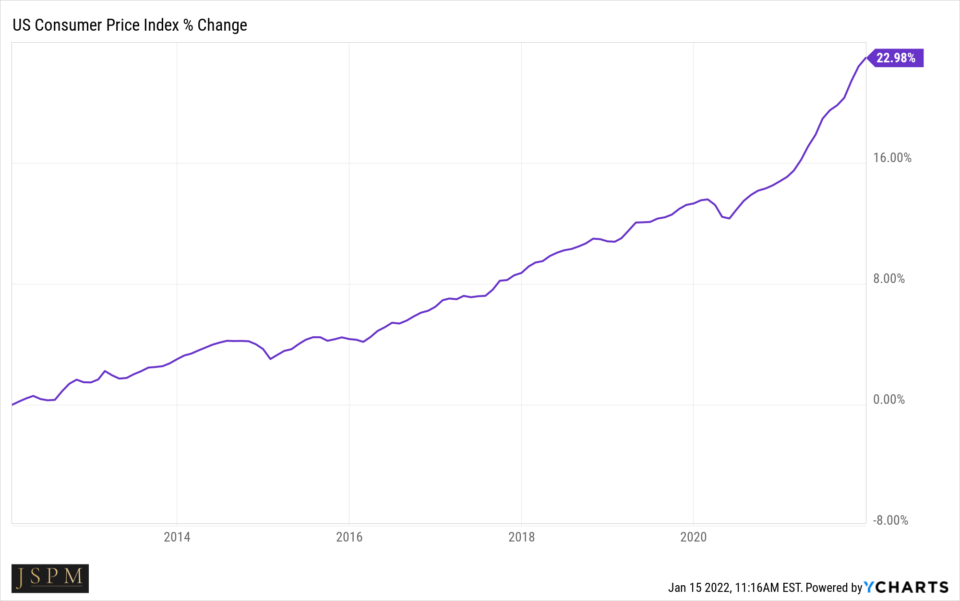
U.S. Inflation is at a near 40 year high. The Consumer Price Index (CPI), as provided by the Bureau of Labor Statistics, measures price fluctuations in a basket of goods and services purchased by American households. The year over year change of the CPI, is the most popular way of determining the rate of inflation. It is published monthly and sometimes referred to as the cost-of-living index.
US Consumer Price Index is at a current level of 280.19, up from 278.88 last month and up from 261.56 one year ago. This is a change of 0.47% from last month and 7.12% from one year ago.
Why does this matter?
Let’s start with the money you may have sitting in a traditional savings or money market account. Let’s assume you are fortunate enough to have $50,000 in savings, tucked safely away from the turbulance of stock markets or other investment alternatives. Last year at this time your $50,000 was worth just that, fifty thousand dollars. Today, the cost of goods and services we purchase are just over 7% higher. So while that $50,000 may look the same, it’s not. It now will purchase you $46,500 worth of the same goods and services. Your hard earned money melted due to the differential of higher costs of goods and services less the record low interest rates being paid by savings and money market accounts.
How does this affect the stock market?
While this answer gets a bit more involved, it is important to understand. Let’s begin with “The Fed.” The Federal Reserve System is the central bank of the United States. It performs five general functions to promote the effective operation of the U.S. economy and, more generally, the public interest. The Federal Reserve has what they refer to as a dual mandate: Maximum sustainable employment and price stability. For our puposes, price stability is the focus. The Committee judges that inflation at the rate of 2 percent, as measured by the annual change in the Price Index for Personal Consumption Expenditures (PCE), is most consistent over the longer run with the Federal Reserve’s statutory mandate. The Committee has also explicitly noted that the inflation target is symmetric and stated that it “would be concerned if inflation were running persistently above or below this objective.
You may remember from earlier we said that inflation was at a 40 year high of 7%, obviously outside of the target level stated in the Fed’s price stability mandate. Record levels of stimulus throughout the global pandemic paired with global supply chain issues has the economy struggling to produce enough goods to match the consumer appetite for those goods is the answer to “Why all this inflation?”
While the Covid 19 crisis is seemingly far from over, the Fed has recently stated its plans to begin doing its part to slow down an overheated economy by increasing interest rates several times this year. Increasing interest rates serves to help slow down loan growth, and lessen the money supply chasing consumer goods and services which in turn will begin to slow inflation, bringing back toward its overall 2% goal as stated in their price stability mandate.
And for stocks?
A primary tool utilized by investors to estimate the value of an investment is the Discounted Cash Flow Model or (DCF). You may have seen it before, but in case not here is that formula:
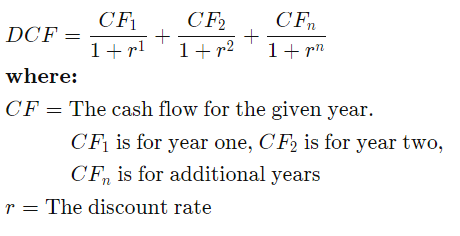
While the DCF model is simple, straightforward and easy to use (unless math isn’t your thing), the difficulty lies in the estimational variables (which are basically the entire equation). Let me explain.
In conducting DCF analysis we use estimations, because in finance and investing the future is never certain. The first estimations come from the CF – possible future cash flows received from business activities, equipment and other assets. If the potential values calculated via DCF are higher than the current cost of investment it is an opportunity worth consideration. That is estimation number one.
Estimation number two is the kicker right here and now. The “r” value you see in the denominator of the DCF equation is referred to as the discount rate. The discount rate is the interest rate set by the Federal Reserve for lending to other banks. The Fed has started to forecast an increase in “r” which we spoke about previously. They’ve stated they may raise rates three, four, or maybe 5 times. So now what you have are estimations going on as they always do in the CF portion of the calculation, as well as estimations going on in the “r” portion of the calculation. That makes for a “wiggly” equation, or if you rather, what you will hear referred to as multiple contraction or repricing of risk.
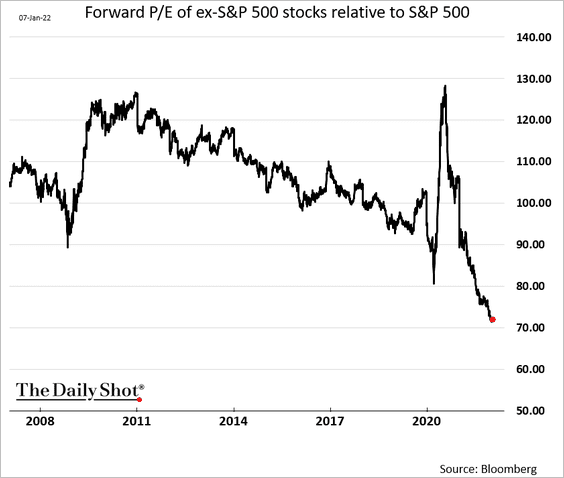
And we have seen just that, for the better part of 9 months or more in many areas of the growth stock universe. The market is a forward looking mechanism, always looking toward the future to try and price is what is to come. Let’s look at some examples of areas of the market that didn’t wait for the Fed to begin pricing in recently updated rate hike forecasts.
ARK Innovation ETF
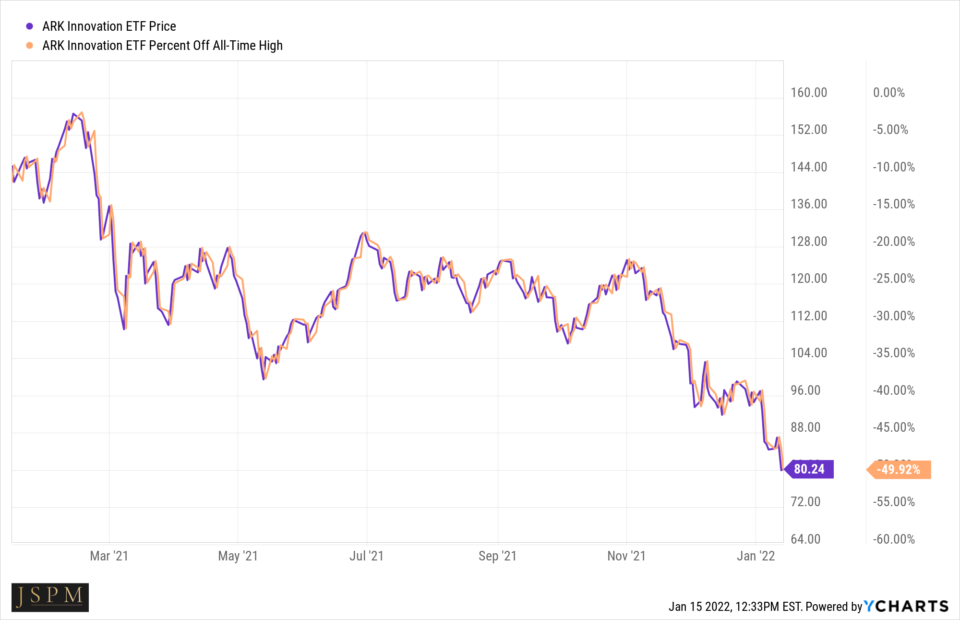
Cathy Wood’s ARK Innovation is a barometer of growth stocks. Beneffiting massively from the “stay at home” theme we saw throughout the start of the Covid 19 pandemic. ARK’s ETFs are focused around investments in the companies of tomorrow. Year over year the fund has fallen nearly 50%. Has the recent stock market’s star manager’s hand turned from hot to cold? No. Her holding’s are being repriced by that “wiggly” equation we saw above.
Many of ARK’s investments are in companies that have little to no free cash flow yet. (The CF we saw in the equation above) and thus have been aggressively repriced from a multiple perspective, and from a “running too far too fast” momentum perspective. Does this mean the companies in which she invests aren’t any good? Far from it. She invests in companies that might one day cure cancer, bring better health care to more people, change entertainment as we know it, make the internet faster and more accessible to the masses, etc. They have simply been out of favor most recently as the market has looked toward more stable, old economy companies viewed as safe havens in times of multiple contraction.
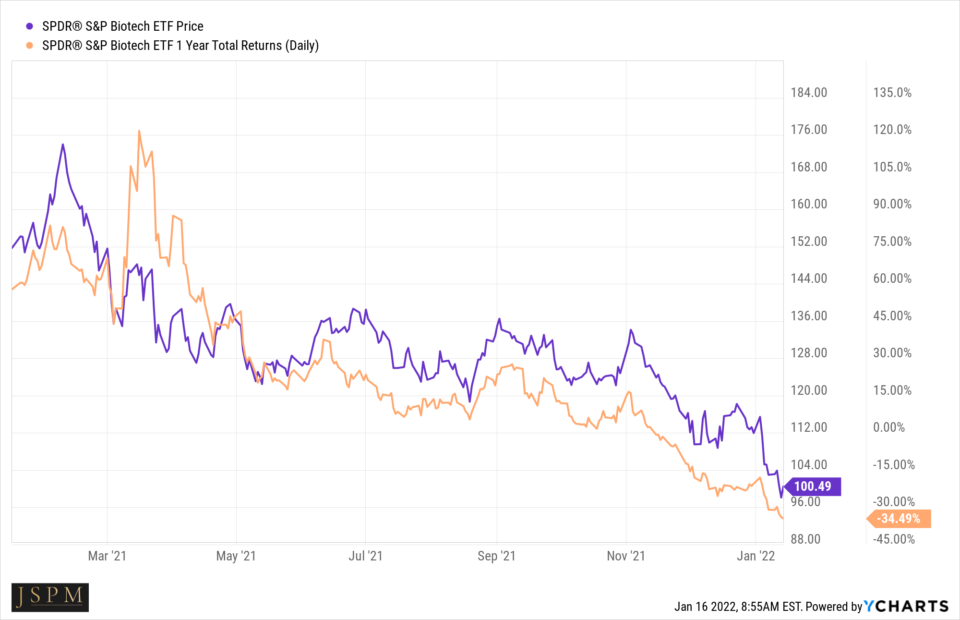
It’s not just ARK. It’s Biotechnology:
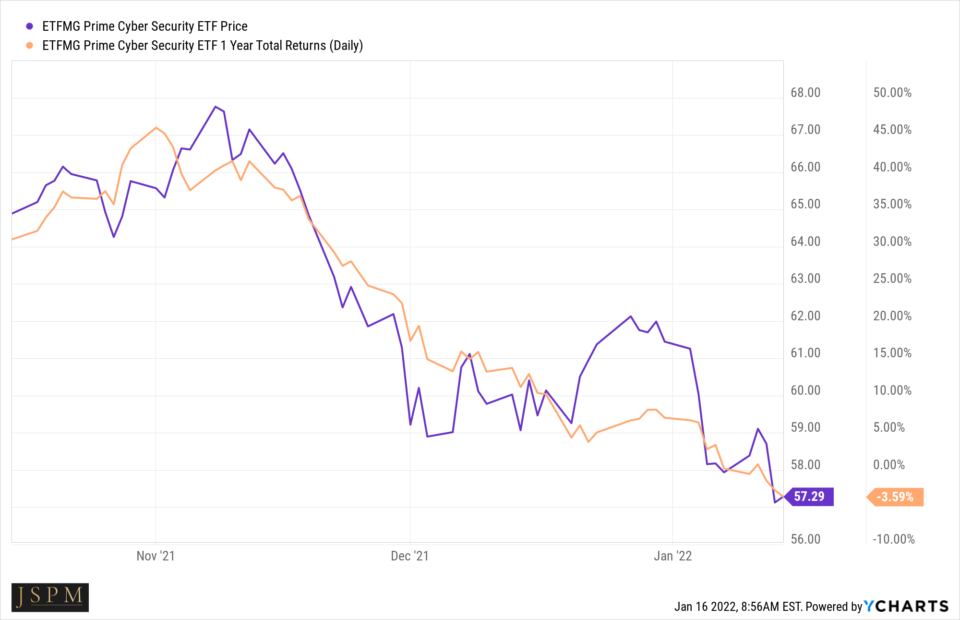
It’s Cybersecurity:
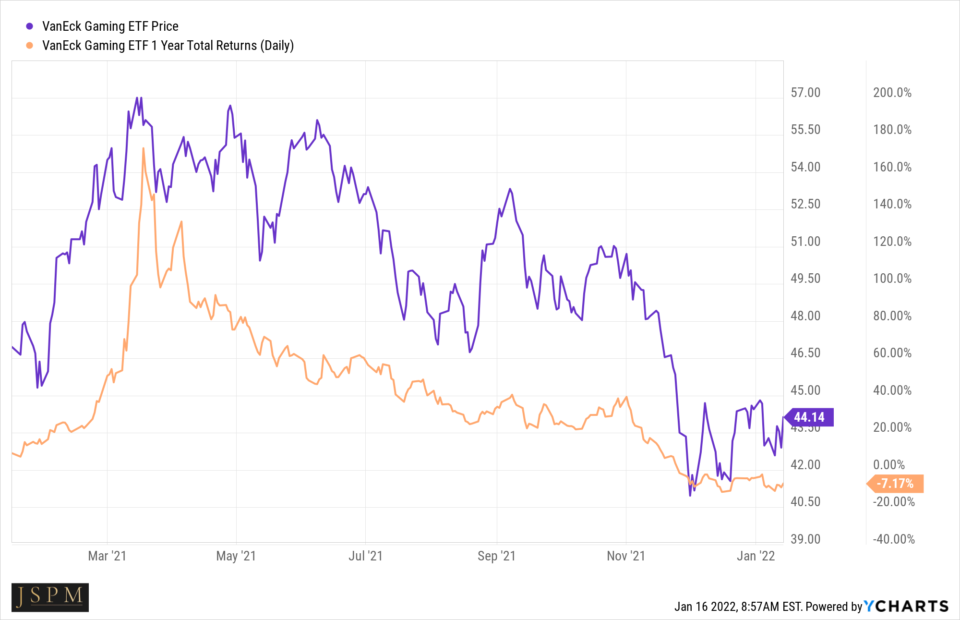
It’s casinos and gaming:
And it is many other important industry groups that will need to participate to keep the overall secular bull market in tact.
If you looked across the market landscape recently, you’d think it was 1970. Market leadership currently is a mix of oil and gas companies, coal stocks, consumer staples, and agriculture chemical companies. This rotation into more stable areas of the market is a defensive posturing due to the unknown. The unknown “r” we’ve seen in the denominator of our DCF model above.
So what happens next?
You may remember the last time the Fed threatened to shrink its balance sheet and raise rates at the same time. In the fall of 2018 this happened:
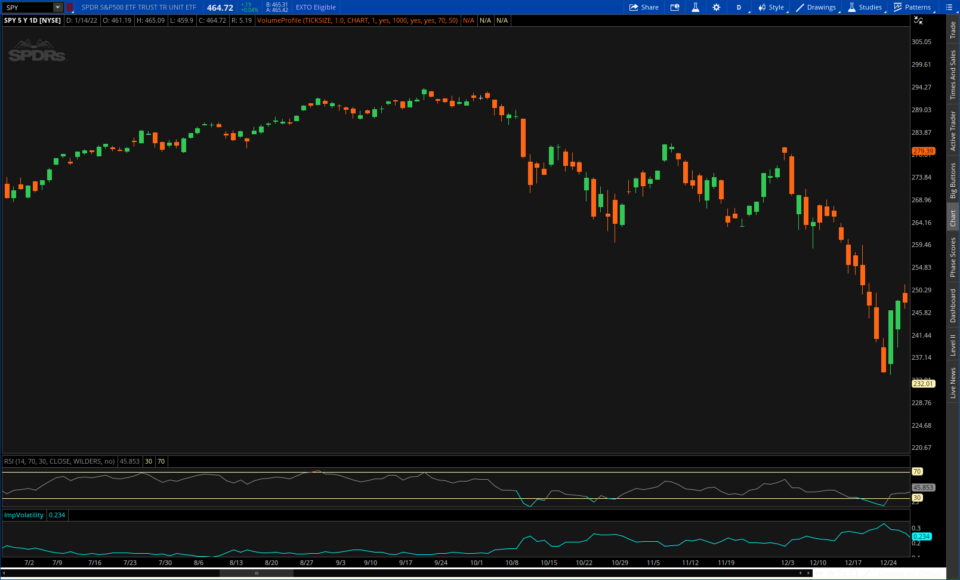
A quick 20% correction took place culminating in a Christmas Eve market “crash.” The following week the Fed backpeddled quickly, effectively saying, “our bad, we didn’t mean it” and it was back to business as usual. This setup the next leg of the bull market.
That quick sell off which shook investors out of their high growth stocks and into cash / defensive stocks was certainly gut wrenching at times if you watched day to day. In tumultous times everything goes down, speculative growth first, quality growth second, and defensives and staples third. And when the tide turns, you most often see the reverse happen. Appetites for the very best and most innovative companies lead the market for months and to a greater extent than any other group.
That brings us to today.
In an environment where we have seen so many important areas of the market fall one after another, how do we feel about the market going forward and what do we think will happen? This is of course any one’s guess. Like I mentioned previously, no one knows with any real degree of accuracy, at least in the near term. However, I’ll give you my educated guesses based on past observation and analysis. I’ll also lay out some historical statistics so that readers can formulate their own opinions.
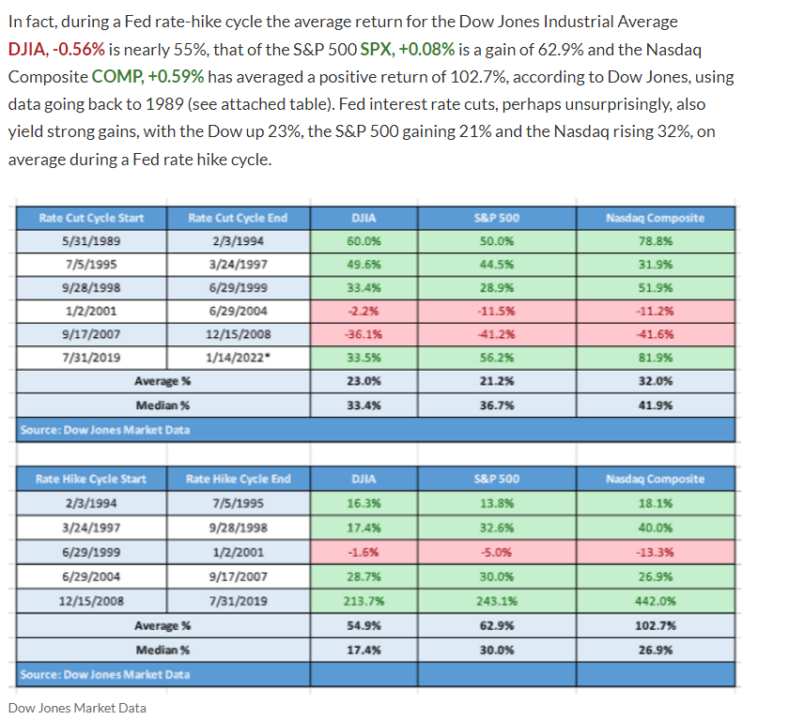
Perhaps contrary to popular opinion, previous rate hike cycles have been good for the market:
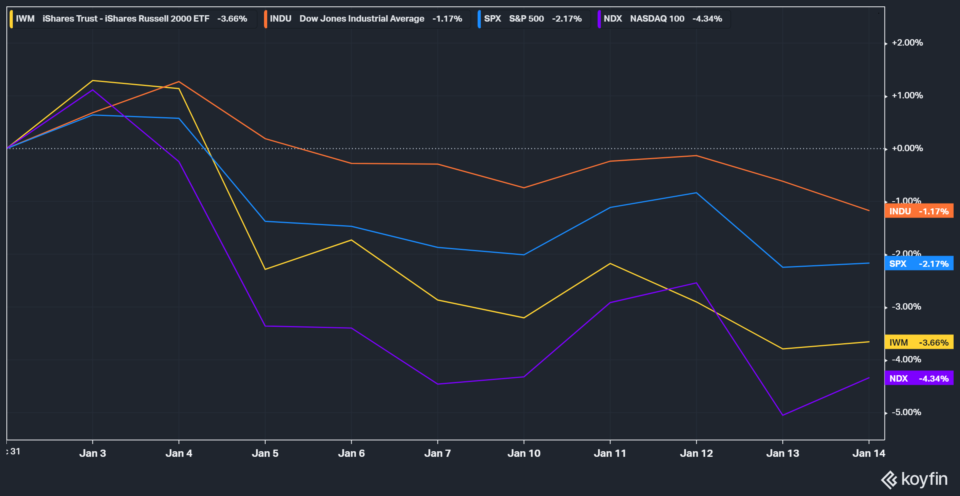
Also, we should take into consideration the January Barometer, devised by Yale Hirsch in 1972. This states that as the S&P 500 goes in January, so goes the year. Since 1950, if the S&P 500 was positive in January this lead to a positive overall year in the market, registering only 11 major errors in just over 70 years. This effect has an 84.5% accuracy rate, which is good news. The bad news is, we aren’t off to a great start, but of course the month is only half over:
To get a bit more stock specific, if you’ve had exposure to growth stocks you’ve already been through a bear market. You’ve been living it over the past 9 months or more. With the exception of large and mega cap growth which are beneficiaries of the consistent waves of inflows from passive investments (like 401k flows every two weeks) you just survived a bear market. I’m not calling a bottom, but we are much closer to a bottom in small and midcap growth than we were 6 months ago.
It is my belief that in the near term the overall indexes are at risk of a run of the mill 10-15% correction. This time however, I do not think we will see the same correction in small and mid cap growth as many of these names are already in deep correction territory. We will be focused on earnings which just started, January inflation numbers which are released in early February, and of course signals from the Fed. We hold that there is no need for panic, but we aren’t ready just yet to get more aggressive. Across our growth strategies at JSPM we have higher than normal cash levels and stand ready to put capital to work once new trends begin, which we expect them to in the coming weeks.
I want to thank you for reading and I wish you all a very happy Martin Luther King Day.
Trent J. Smalley, CMT
Visit our websites: (MyPortfolioFix)
Please remember that past performance may not be indicative of future results. Different types of
investments involve varying degrees of risk, and there can be no assurance that the future performance
of any specific investment, investment strategy, or product made reference to directly or indirectly in this
newsletter (article), will be profitable, equal any corresponding indicated historical performance level(s),
or be suitable for your portfolio. Due to various factors, including changing market conditions, the content
may no longer be reflective of current opinions or positions. Moreover, you should not assume that any
discussion or information contained in this newsletter (article) serves as the receipt of, or as a substitute
for, personalized investment advice from JSPM LLC. To the extent that a reader has any
questions regarding the applicability of any specific issue discussed above to his/her individual situation,
he/she is encouraged to consult with the professional advisor of his/her choosing. A copy of our current
written disclosure statement discussing our advisory services and fees is available for review upon review.