Good morning. The following information will provide a quantitative look at the JSPM Omaha Growth Strategy managed by myself and Ryan Morse, CMT, CFP. We believe in providing current and prospective clients timely updates with regards to performance vs. benchmarks. As stated previously, this particular model is an equity growth strategy designed to generate an above-average, risk-adjusted rate of return over time. Capital gains are the strategy’s primary objective. Some current income may be earned through dividends, but income is not a primary objective. Below are statistics and charts of the portfolio’s inception through October 16th.
Cumulative Return

Overall return in approximately 3 months stands at just over 16%. The strategy saw a slight drawdown overall in the month of September (-1.35%) and is enjoying its best month so far here in October (+11.67%).
The portfolio is actively managed and thus is constantly being compared to benchmark indexes. A graphical look follows comparing the JSPM Omaha Growth strategy to the S&P 500 Total Return index (SPXTR), the iShares MSCI EAFE ETF (EFA), and the Vanguard Total World Stock Index Fund (VT):
Historical Benchmark Comparison
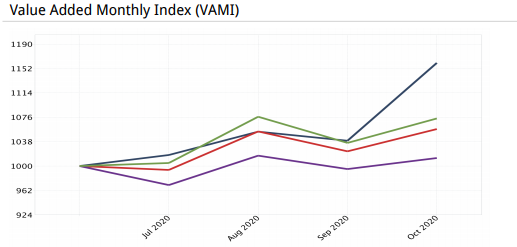
SPXTR (Green)
EFA (Purple)
VT (Red)
JSPM Omaha Growth (Dark Blue)

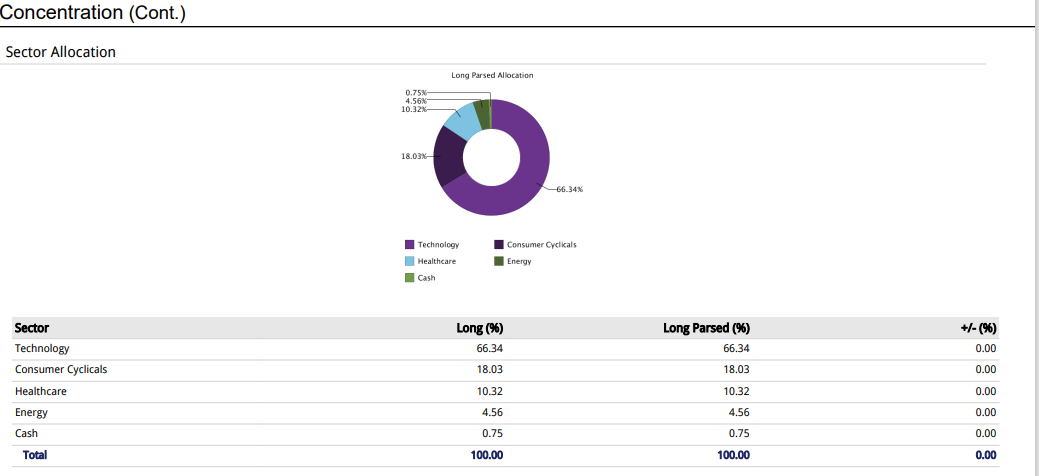
In an attempt to outperform, the model is allocated to the strongest sectors in the market. While this is everchanging, technology has been and will likely continue to be the dominant leader in the market. It comes as no surprise that we are heavily invested in this sector.
Sector Allocation Concentration

An alternative way to look at performance versus benchmarks follows. The same color key applies as the previous performance charts above.
Time Period Benchmark Comparison

The portfolio went live in the final days of July and got off to a great start. August saw underperformance vs. the benchmarks as growth stocks and technology stalled. Thus far in October the model has more than made up for it. What I am most proud of in this particular chart is that in September, our portfolio experienced less of a drawdown than all of the benchmarks. This signifies an emphasis on risk management. In short, we play good defense, too.
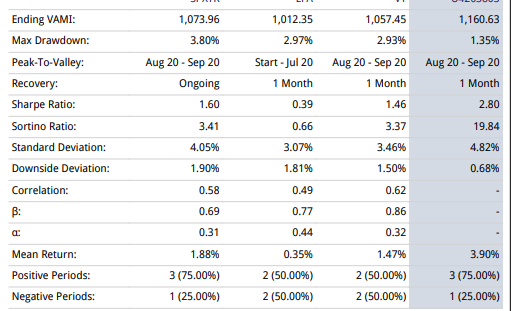
An important component of asset management is risk management. It is maybe the most important component of managing money actively. The following shows statistics around how we compare to the aforementioned benchmarks:
Risk Measures Benchmark Comparison

The far right highlighted column is the JSPM Growth strategy. Of note in the above table: The max drawdown was less than 1/2 of the drawdown experienced in the benchmarks (defense), and a Sharpe Ratio (measure of risk adjusted return) double that of the comparison indexes. In short, we outperform while paying special attention to managing risk and protecting investor capital.
Finally, let’s take a look at the VAMI (Value Added Month Index) of our portfolio versus the benchmarks. A value added monthly index (VAMI) tracks the monthly performance of a hypothetical $1000 investment, assuming reinvestment, over a period of time. VAMI is commonly used to depict a fund’s overall performance to investors. (Color key remains the same – JSPM Omaha Growth Strategy is in dark blue)

In sum, we are happy with the performance of the portfolio relative to several benchmarks. The above charts and tables serve to show that we have outperformed passive management on a relative basis over the time period in question. More importantly, we believe it demonstrates our strict risk management principles we employ to guard against market downturns.
We will continue to provide updates like these for transparency purposes across all of our portfolios.
Ryan and I are accepting new clients if you or anyone you know may be interested. We have a new website on the way as well and you’ll be the first to know as soon as it is completed.
Have a great week!
Trent J. Smalley, CMT
