Hamilton Bolton said in 1953, “For every 100 investors who have heard of Dow Theory, there is probably not one who knows about Elliott’s Wave Principle.”
I would argue that today, some 64 years later this is still largely the case. Mentioning Elliott Wave Principle even to veteran traders returns perplexed looks. In my experience there are two camps when it comes to Elliott Wave Analysis: Those who dismiss the practice as voodoo and those who are familiar but haven’t done the necessary study to apply it to markets.
The newly named CMT Association teaches the basics of EWP in the Level I CMT Program, but doesn’t investigate the complexities of the process. It wasn’t until my completion of the program that I began an in depth study of the body of work Ralph Nelson Elliott began about a century ago. I’ve spent several months with EWP now and feel I have enough command of the subject matter to apply it to my trading.
A full analysis of Elliott Wave Principle or in depth look at R.N. Elliott’s works is beyond the scope of any single blog post. Just below are links to further EWP Education I recommend if you are interested:
If sitting down with a book isn’t your preferred method for studying complex subjects, I recommend paying for one of Todd Gordon’s Elliott Wave programs. He applies EWP to today’s price action in the indexes, stocks, futures, and now cryptocurrencies. Day by day application via TradingAnalysis.com will aid in solidifying the theoretical approach you gain from the above texts.
Without further ado, let’s get into it!
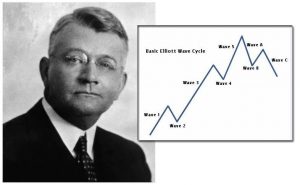
The picture above next to R.N. Elliott is the very essence of a basic Elliott Wave Cycle: A 5 Wave Move in the direction of the major trend followed by a corrective 3 Wave pullback. A completed movement consisting of 5 waves ties in with that part of the title “Secrets of the Universe.” The figure 5 can be seen in prominence throughout nature, as in the case of the human body: Five extensions from the torso – head, two legs, two arms. Five extensions from the head – two ears, two eyes, the nose. Five fingers per hand, five toes per foot, five senses: Taste, sight, smell, touch, hearing.
You will see examples of price action looking similar to the above chart all over the global markets. Stocks, bonds, indexes, futures, Bitcoin, etc. all have the propensity to take the form of a chart similar to the above. Why? Because human emotion and actions are rhythmical. They move in waves of definite number and direction and repeat themselves time and time again. Due to the fractal nature of markets, wave counts are seen on charts of all time frames. Some quick examples I just pulled give you the idea:
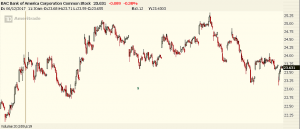
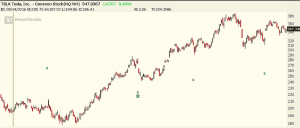
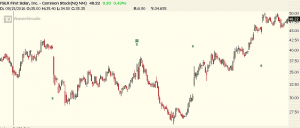
At the very minimum, you can get your eyes used to thinking in terms of waves, accumulation, distribution, break outs, and pullbacks. The first two charts are daily charts, while the $BAC chart is intraday. Don’t worry if the charts don’t follow the “typical” Elliott Wave appearance shown in the Basic Elliott Wave Chart above. They seldom do. Keep in mind that while there is a specific set of guidelines with EWP, there is a component of art to the process. Some financial instruments in my personal experience adhere to EWP in an undeniable fashion, while others you would be hard pressed to find any wave count. That is fine. If at first glance I can’t discern a possible Elliott count, I move on.
Stocks with an “emotional charge” to them are great candidates for Elliott analysis. (Think $SNAP, $TSLA, $GOOGL) Also, futures contracts like the E-Mini indexes and cash indexes like the Dow 30 have displayed adherence to EWP for as long as they have been around. The Dow Jones Industrial Average is the example used in many of the predominant Elliott Wave texts.
Most recently, the explosion in popularity of actively traded Cryptocurrencies like Bitcoin, Etherum and Litecoin have provided additional instruments that seem to follow the Elliott guidelines especially well. A quick description of these guidelines as well as what kind of sentiment to expect from each Wave.
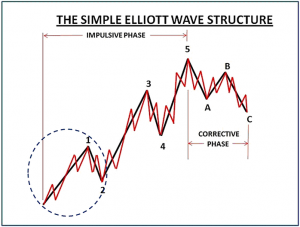
Wave One: Poor fundamentals, fully bearish sentiment and very few sellers left to push the market any lower. Price begins to rise.
Wave Two: Those bears still short remain confident that Wave One was just a fluke. Fundamentals remain uninspiring but a small group of market participants are gaining interest as Wave One entices them to get long for a possible coming uptrend.
Wave Three: Those still short begin to feel the pain as price overtakes the highs made in Wave One. Buy stops are forced to cover, adding fuel to the fire. Momentum longs begin to take notice and pile in further driving price higher. Financial media starts to notice and fundamentals improve guiding price into an unmistakable uptrend.
Wave Four: Long sideways “breathers” in price as some decide to take some off the table. This Wave is seen as a battle between bulls and bears that frustrates many as price is trying to decide whether to reverse lower or continue trading up.
Wave Five: The fundamental picture becomes one of beauty and the amateurs begin to come to market. Your aunt begins asking if you can put some money into the market for her because everyone is talking about getting rich. Optimism is running at all time highs and there is FOMO in the air.
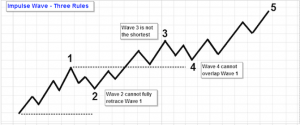
In Elliott Speak, Waves which unfold in patterns of 5 are called Impulse Waves. There are “rules” for Impulse Sequences which if violated, deem the structure incorrect and must be reevaluated. These rules are as follows:
A. Wave Two must not retrace past the beginning of Wave One.
B. Wave Three cannot be the shortest of the 3 impulse waves (1,3,5). It doesn’t have to be the longest, but cannot be the shortest.
C. Wave Four cannot overlap or trade back into the territory of Wave One.
In stock markets, we often find Wave Three to be the extended or longest of waves 1.3,5 while in the futures we find that Wave Five is generally extended.
If you are still with me, I want to attempt to simplify all this as much as possible to the task at hand, which is to try and forecast where we expect Bitcoin to trade going forward. Just realize that I am doing R.N. Elliott an injustice in this simplification.
You have seen now that price trends in wave counts, and that an Impulse Sequence is carried out in a 5 Wave move. Waves 1,3,5 are moves in the direction of the trend, where as Waves 2 and 4 are corrective waves against the trend, or minor pullbacks.
So what? So let’s dance!

The number ONE Elliott Wave Principle Objective is to identify specific setups based on patterns that have a high probability outcome and know when specific market activity invalidates anticipated outlooks.
Elliott Wave Theory has 3 Primary Price Projection Techniques:
1. Retracements
2. Alternate Price Projections
3. Price Expansions
For our purposes, we will focus on Retracements and Projections. Enter Fibonacci…
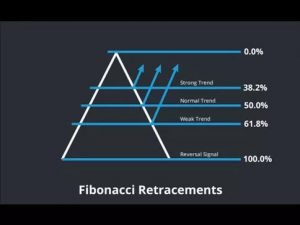
I am going to assume you have a basic understanding of Fibonacci numbers and how they are applicable to markets. If you aren’t and need some coaching on this, email me I am happy to help. Free! Just like this website.
With your new Elliott Colored Glasses on, I bet you can start to see wave counts:
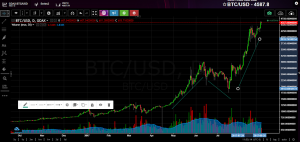
Go over our rules to make sure we are in Elliott compliance:
1. Wave 2 doesn’t retrace past the beginning of Wave 1. (Check)
2. Wave 3 isn’t the shortest of Waves 1,3,5 (Check)
3. Wave 4 can’t trade into the territory of Wave 1. (Check)
In terms of the basics, so far so good.
Applying Fibonacci retracements to our chart above let’s see what happens.
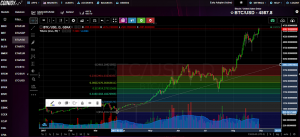
Interesting level where price happened to bounce at the completion of Wave 2? Maybe coincidence.
But then it happens again in another cryptocurrency, Etherum:
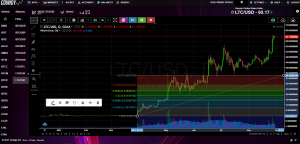
It happens again and again, but to stay with the topic at hand we can use Fibonacci Projections to give us an idea of next levels of possible resistance.
Further along in your Elliott studies you come to learn the most important ratios for price projections. You will learn of the 1.618% which happens to be The Golden Ratio. (1.61803398875) Taking the 1.618% Fib Projection of the Wave 1 we find this:
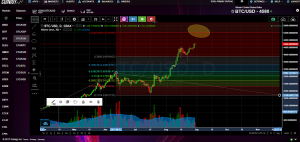
$5200. Bitcoin is going to $5200. Now sign up for my alert service and pay me my monthly fee.
Kidding.
I have no idea if Bitcoin is going to $5200 or 0 and neither does anyone else. I can almost guarantee it won’t go to 0 and I’d be willing to wager that $5200 is within the cards by end of September. Further Elliott study gets into not only price projections, but also time projections. As I have stated, I have purposely oversimplified Elliott and have left out major pieces of crucial analysis to keep this (relatively) short. I wanted to expose you to this methodology as it pertains to markets, specifically cryptocurrency.
If there is some interest out there in learning more about Elliott Wave Principle send me an email. There are a couple projects in the works if you want to fully submerse yourself in this to add to your trading repertoire.
Thanks for reading.
OC
