It’s getting late …….
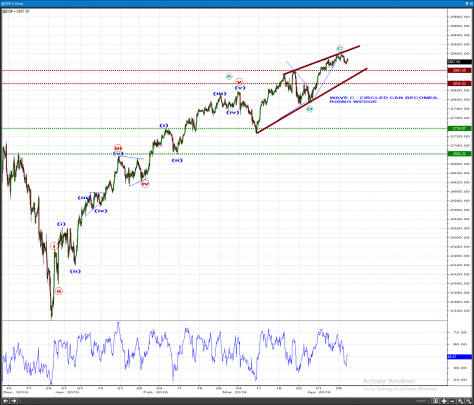
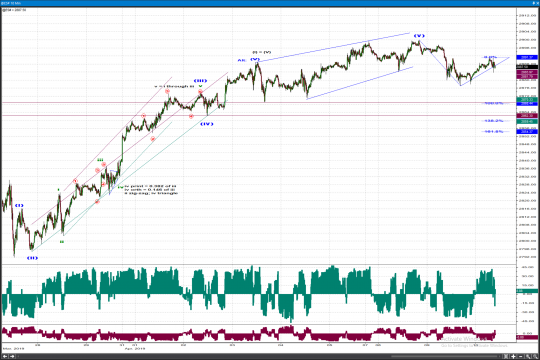
The pattern is starting to make a bit of sense here so I am posting an updated 2hr ES – E-Mini S&P 500 count plus I am showing you what I think I see on the 10 min chart. The B wave party is getting late here.
2HR ES:
The main count suggests a post-triangle thrust is being consumed. What we label as wave C-circled up may well be only wave 1 of C-circled. We’ll watch for hints at the 2863 / 2835 supports. The alternate potential for wave 1 of C is eliminated below those.
A 2nd alternate interpretation suggests wave C-circled traces out a rising wedge / ending diagonal triangle that needs one more push to new highs. Do connect the reaction highs as I am showing on the first chart and if the market pops up above it and then collapses quickly raise this alternate to preferred status. I would not be totally shocked to see this steep unsustainable rally end with the most bearish of patterns known to both Elliott and other technical analysts.
10 MIN ES:
In very simple terms, a push below 2868-2870 will lead to an accelerated decline. Based on the larger degree alternate potential I am not entirely convinced we’ll crack 2870 right away but one thing I will suggest is that sometimes when you’re getting a bit too cocky and seek perfection on a set-up you end up simply missing the trade. I am currently looking for ways and places to trade my first batch for myself.
Either way what we see right now is neutral at best and strongly bearish at worst. This is not the time AT ALL to be too enthusiastic. Trent and I will give you a full update in a week’s time, in the meantime have fun and e-mail us if you have questions.

 [/vc_column_text][/vc_column][/vc_row]