
As the market begins to slow into holiday trading mode, it’s a good time to go over current short, and long term positions as well as scout the landscape for new opportunities. In our trading room over at Trading Addicts we spend at least a day each week on idea generation. In other words, searching for setups which are close to being actionable. One name that came up over the past couple of days was Clovis, symbol $CLVS. Let’s take a look at why this might present a good short / long term opportunity.
It’s important that we look at multiple time frames in order to ascertain possible opportunity, whether that be from the long or the short side. I always start by looking at the longer term time frame, in this case a two year, daily chart:
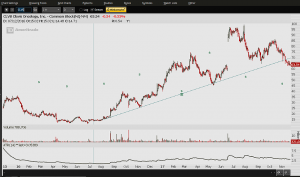
Traditional old school technical analysis books might take a look at the above chart and say that the primary, long term uptrend has been broken, and the stock should be sold, or possibly shorted. The wording might say, “What was once former support will now act as overhead resistance.” Some refer to this as the Principle of Polarity, a study of supply and demand dynamics.
More recently however, the market has evolved to know what the crowds are watching, and will do its very best to shake its participants out of trades. Those who continue to rely on technical analysis printed in books 50+ years ago are likely having a hard time making money. Our markets are constantly evolving, and making us evolve with them if we want to continue being profitable.
Today’s market will see the chart above, know that you read Edwards and Magee and will run stops under the trend line, before reversing and resuming higher. It’s a cruel, cruel World.
Now that we have identified the long term trend and a possible “stop trigger” we can zoom in to see if we have confirmation on shorter term time frames.
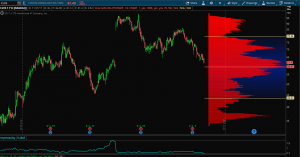
On a one year time frame, we can see that $CLVS is falling into its Volume Point of Control, taking into account one year of price history. This is the level where the most shares have traded hands in the past year, and acts as support for the stock. An ideal spot to enter the trade would be right around the $59.00 level should we get an opportunity to do so.
Further, the Implied Volatility level is at extreme lows so a major move isn’t expected, making option premium cheap to purchase should we choose to play options instead of buying stock.
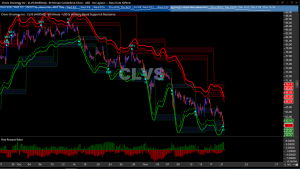
At this point I have enough reason to want to take action on the long side, especially if the stock comes into Point of Control. But it’s always prudent to take a look intraday and see if we can enter the trade with surgical precision. You may not think it matters that much to be picky with your entries, but it can make all of the difference in your P&L, especially when it comes to derivatives trading.
For intraday precision I use a proprietary tool called Volatility Based Support and Resistance Levels. I pay attention specifically to an intraday 60 minute chart, pairing the Risk Reward Ratio study at the bottom. Take a look at the well defined support bands, and the RRR Skew in favor of the long side:
Enough stars have aligned to peak my interest. Due to the low Implied Vol, I will be taking action on this trade via the purchase of option premium. I expect to enter the trade tomorrow, likely January expiry 65 strike calls.
If you see something wrong with this trade please let me know this evening, or forever hold your peace.
OC