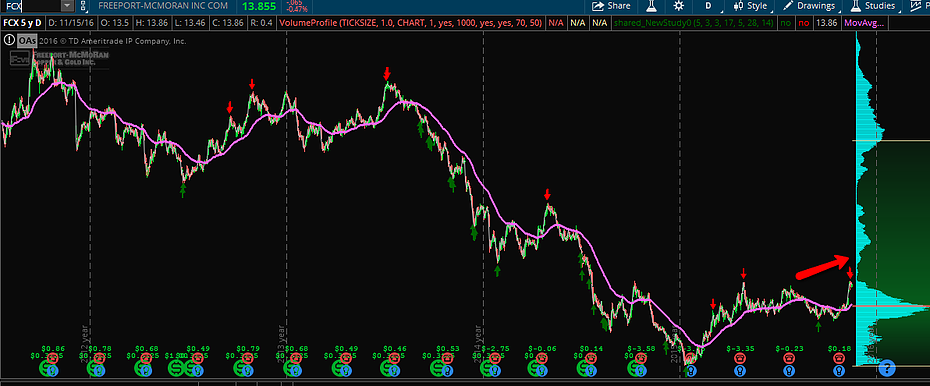
Charts of $FCX seem to suggest the producer of gold, silver and copper will continue to $20 and beyond and I would be looking to add to the position on a pull back to $13. Volume profile on the chart below shows a clear path to $20 with little real resistance to $30.

In addition, a possible inverted complex head and shoulders pattern may be in play. For H&S we like the pattern to be more symmetrical but this may serve us well for confirmation of a bull trend to continue.

I am long of $FCX DEC calls of the 11th strike.