
U.S. investment banking giant Goldman Sachs has been vocal in their bullishness of commodities for 2019, specifically that of gold. In the early going they have been correct, but I think a near term short opportunity is presenting itself here.
Here are a couple of things I am watching:
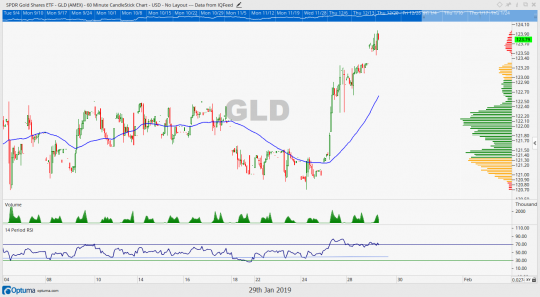
An intraday chart of GLD so far this year shows that gold has gapped up into the 2nd standard deviation territory. In short, price is a stretched rubber band which can snap back toward more agreed upon levels of value at any time.
As an industry group, gold stocks are stretched also. Take a look at the OB signal displayed in Exodus Market Intelligence for the gold stocks:
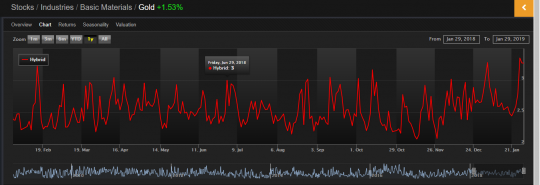
You can see that when the oscillator gets stretched out to these levels, it tends to mean revert fairly swiftly.
Looking at a weekly chart with simple Bollinger bands added, we can see how gold reacts when price closes outside of the top Bollinger band or pushes up through it:
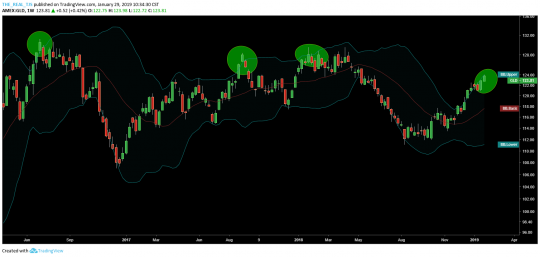
If history is any tell, GLD is ripe for a reversal in the near future. I won’t call the top, and I won’t call the bottom but for a trade I think this is setting up.
I am in GLD February puts in an effort to capture profits as GLD mean reverts, getting back to a more delta neutral position.
![]()