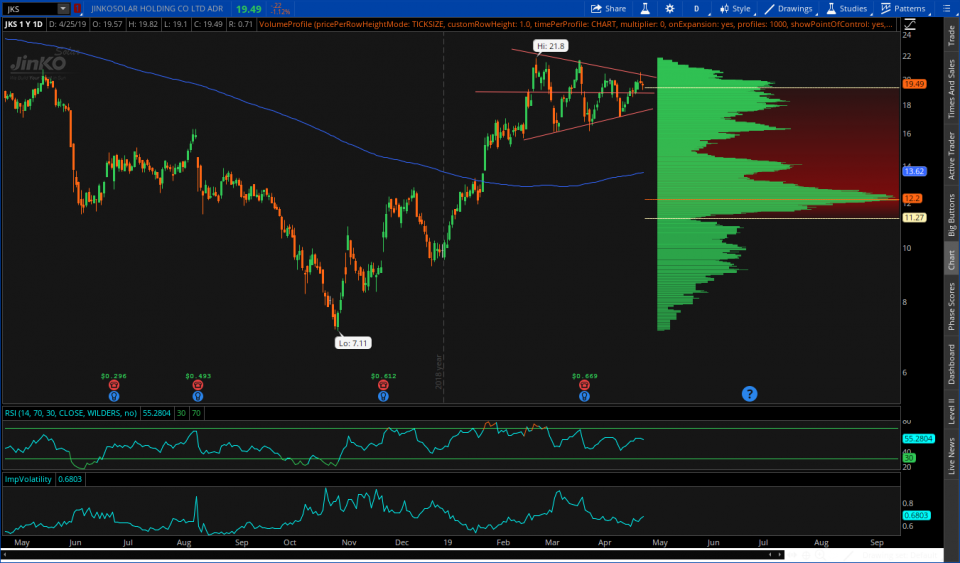
Happy Thursday. Yesterday’s post highlighted an objective approach in taking a short trade. Today we will reverse course and do the opposite which is take a long trade based on a subjective premise. Triangle chart patterns are second nature to a technical trader. They are important because as price coils and a stock undergoes contracting volatility, it follows that price will move quickly when there is a breakout from the pattern. When volatility expands outside of this pattern, traders can capture outsized moves if they are on the right side of the trade. Let’s see if today’s setup can do just that:
STOCK SETUP #4: JKS

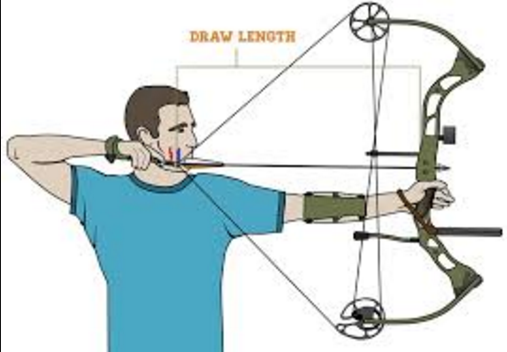
We can see that thus far in 2019 JKS has been in a well defined uptrend. Consolidation patterns like the one we have here tend to resolve in the direction of the underlying trend. This is why we plan on JKS breaking out to the upside. For the past two months price has ping ponged back and forth between two converging trendlines. The first time I saw this pattern I always thought of a compound bow. That observation actually is somewhat helpful to this day. When you draw a horizontal line through the midpoint of the triangle, oftentimes you will find that toward the apex of the triangle price will bounce at the midpoint instead of making another touch of the bottom trendline. I’ve used that as a signal that the expected breakout is near. In this case if JKS came back into the midpoint one more time I would look to take my long trade from there. If price stops at the mid near the apex that shows seller exhaustion and is a good indicator a move higher is around the corner.
The “Bow Draw” pattern is easy to spot and provides a higher than chance probability of a move in your favor. These patterns come from stocks taking a breather after a move higher and you want to keep a list of them handy at all times to increase your chances of achieving positive alpha.
Trent J. Smalley, CMT
