
For the hump day edition of this week’s five setups in five days I wanted to turn your attention to a short setup. I want to preface this post with a disclaimer: Shorts are not my forte. I have never been able to consistently make money by betting on the downside. Maybe it’s just now how I am wired or maybe I haven’t spent enough time perfecting that skill set. Pair that with the fact that we are in a market that does nothing but go nearly straight up and you have a recipe for a loss on your hands. However, there is a place and time for them and one stock I see right now might fit that bill. Let’s take a look:
SETUP #3: SHORT SCS
My short setups generally rely on objective measures of analysis. In other words the “what is” rather than the “what might be.” Chart patterns are an example oftentimes of what might be. It’s common for one person to see a particular pattern and another person see something quite a bit different. Objective measures include volume by price and statistics. I need a minimum of two objective measures and ideally three to all be working in my direction before I ever think of taking a short.
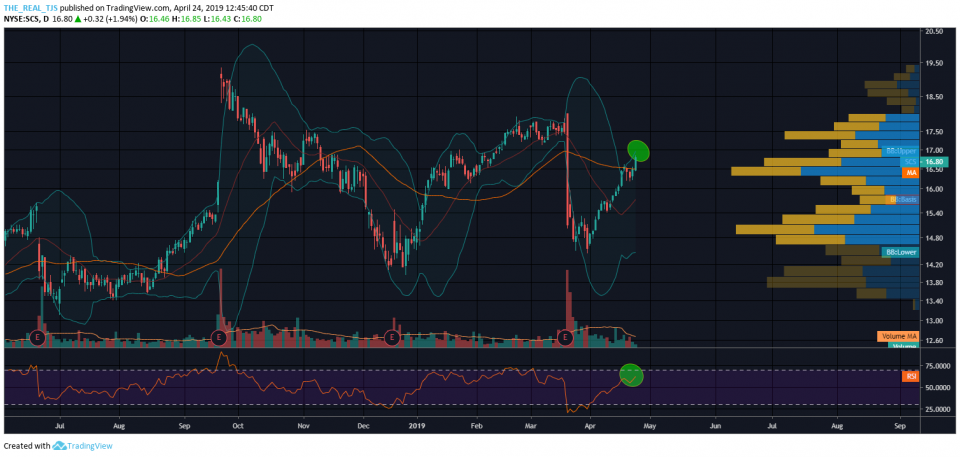
In the chart of Steelcase Inc, SCS above we have three objective measures of analysis working for us.
- The RSI Index is approaching the upper band or oversold level which it has respected fairly well over the past year. We can see that as this line has approached the upper band, we have seen it revert back and price has done a decent job of following.
- Take a look at the drop the stock experienced on heavy volume at the end of March. When a stock sells off on heavy volume like this, it is rare to see price trade back up through those prior levels without rejecting higher at least a couple of times. We can see price levels oncoming where the stock got obliterated in the past. The level has memory and it will take a colossal effort for price to recapture this level.
- The green bands around the price action are Bollinger Bands. In short, the upper and lower bands are simply lines that signify two standard deviations from a simple moving average of price. This can be anything you choose, but the standard is 20 period. As price approaches that upper band we should look for a pullback. Price tends to spend more time in the middle area between the two bands than up against them or outside of them.
None of these measures on its own would be enough for me to line up a short on any stock. I need at a minimum two and preferably three come together to signal price is due to cool off. Even with all of these as is the case with SCS, I am hesitant to try my hand at a short here. If I do I always bet via the options market because you know at Omahacharts we respect risk, and shorting a stock does no such thing.
See you tomorrow!
Trent J. Smalley, CMT