A luxury we have as stock pickers is being very selective when it comes to deciding whether or not to enter a long, short, or neutral position. When entering a long, my favorite setups are those where I know exactly when my thesis is wrong. This leaves little to no guesswork. We don’t like guesswork.
How do I know when I am wrong? It could be a number of ways, but most often it comes in the form of a trend line violation, a fall in price under a certain level of the volume by price, or a break of a specific chart pattern. In special cases, stocks will present you with an obvious level via a confluence of factors. Here you have a price area where we can be almost certain, it’s better to cut our losses and move on.
One such example of this right now is that of Disney, $DIS.
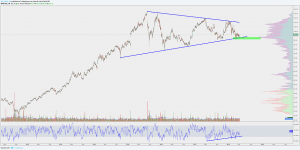
Disney is in a consolidation range, a well defined triangle pattern exhibiting at least 3 touches on the top and bottom of the narrowing pattern. Also, in terms of the daily chart, price is sitting right at the area of the most volume traded, or the VPOC. As the VPOC as well as the lower bound of the triangle pattern act as support, should price fall much more than 5% lower from it’s current price around $101, I would abandon the long position. The width of the triangle is approximately $30 so a breakout of said pattern gives us a price target on the upside of $140.
That is the kind of risk/reward I am comfortable with: A $100 stock, with $5 of downside and $40 of upside.
Earnings is this coming week so a decision will need to be made whether or not to engage this as an earnings play, or wait until after earnings to put on a position. I will leave that up to you.
How would you play this one?
I hope you all had a wonderful weekend.
OC