It has been a minute since I have written about an “indicator” here on Omahacharts but I wanted to just that today. While I am familiar with almost all of them (and had to calculate most by hand for the CMT Program), I haven’t been an advocate of heavy indicator use in a long time. While indicators can assist us in our trades, it is only price that pays whether or not our desired indicator chooses to confirm the move or not. However, their utility comes from just that; confirmation. Let me lay out a trade I put on yesterday as an example of using Williams % R which is a momentum indicator that oscillates between 0 and -100.
Before we get into the chart, here are some notes on Williams % R for your reference:
This is a versatile indicator that provides some insight into the recent strength or weakness of a financial asset, it could be a stock, futures contract, Forex pair, or cryptocurrency. The standard period is a 14 period whether that be day, week, minute, etc. interval. It takes into account the most recent closing price, the highest high over the past 14 periods and the lowest low over the past 14 periods.
The versatility of Williams % R comes from the ways in which it can be utilized. It can be a simple measure of overbought or oversold, alert us of a changing sentiment with the risk asset, or my personal preference which is divergences from price.
As I have said over and over, indicators are meant to be used as a confirmation tool to what is most important: price. Never should they dictate your trading decisions. Think of indicators as the final green light go ahead on a trade you had selected based on price that had a risk/reward profile skewed in your favor.
An updated chart from MNST with price, volume, volume by price and Williams %R:
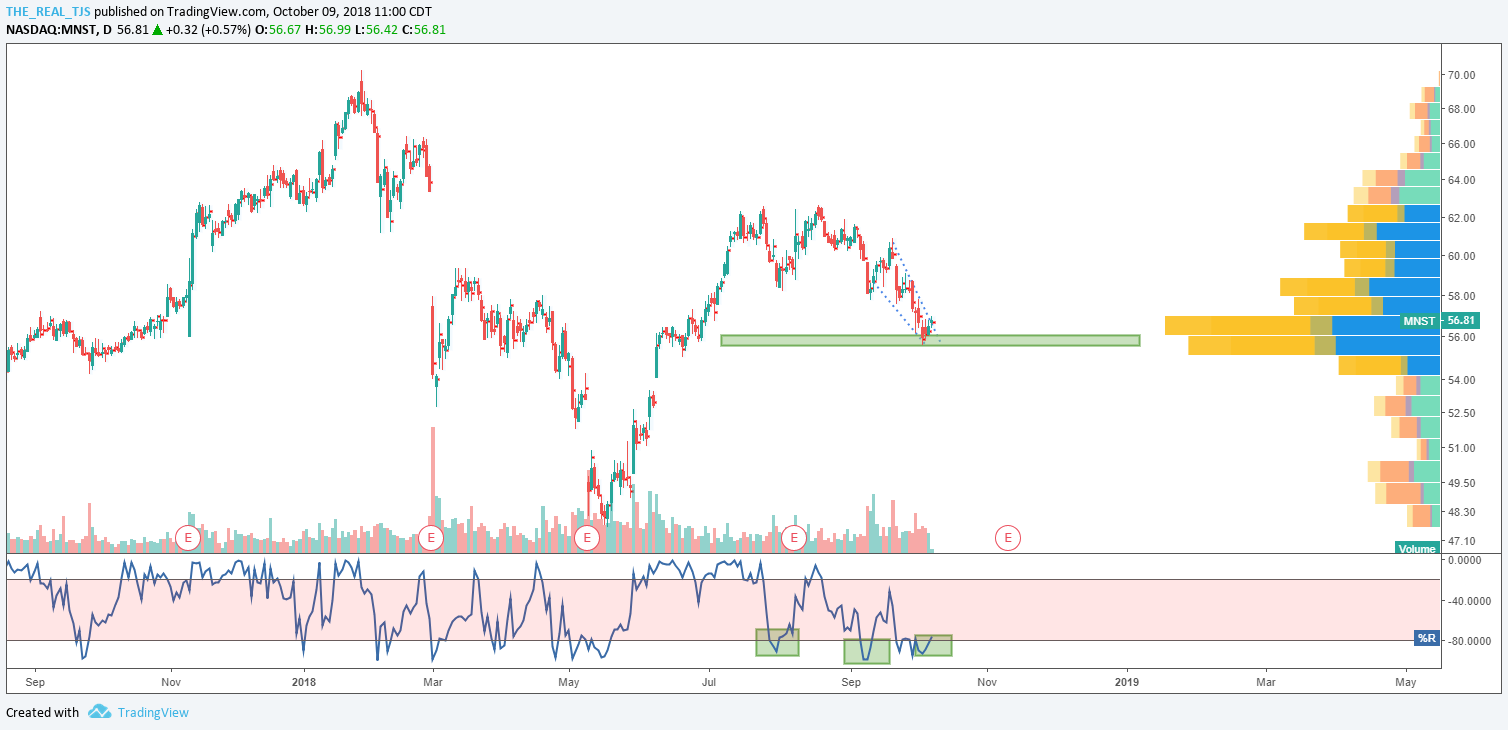
When I see this chart I see a few things working for us. Let’s go through them one by one as you may not see the same thing, and that is perfectly okay.
- Zoomed out the overall look and feel to this price action has the structure of an inverted head and shoulders pattern. Maybe the left shoulder got broken in a cage fight, but none the less I see that at first glance. Knowing that these patterns often resolve upward after putting in a right shoulder, we have bullet point number one in our thesis for getting long the stock.
- Price pattern as this shoulder is carved out is in the form of a falling wedge which is a bullish pattern often times in the context of an uptrend like we have in MNST from May until July.
- The falling wedge pattern has come into the volume point of control on the one year daily chart. This is the area where the most volume has traded in the look back period in question. We know from experience that price respects these levels of high volume (called High Volume Nodes or HVNs) and often they provide the best levels of support and resistance, superior even to trendlines.
- And alas we come to the confirmatory indicator. In our case we are using the Williams %R in two different ways with the MNST chart above. First, as an overbought/oversold signal. When the indicator lines dip into the -80 to -100 region (the white shaded region under the red area) we have a Williams %R Oversold signal. This means we can expect a rally in the coming sessions in price. I have highlighted 3 green rectangles above. The first two moving from left to right were accurate in their signals. Price reacted higher once the OS levels were achieved. Further using it as a tool to signal a bullish divergence, the indicator began to move up while price was still trading lower. On the rectangle furthest to the right we have the indicator moving into OS territory and it has now begun to cross back up, signaling to me that price may soon follow.
So due to the major pattern, the recent short term pattern, the support beneath from the VPOC level and a confirming Williams %R indicator, I want to be long MNST.
A point of major importance comes in here that was nailed on the head by Assad Tannous on Twitter. @AsennaWealth tweets, ” I’d forgotten how easy making a call was when you’re not trading it. Just because you can chart, doesn’t mean you can trade.”
I don’t think any truer words have ever been spoken in the Fintwit universe. You are half done after reading my post above and deciding for yourself you want to risk money on MNST.
What’s left? The REAL part. The trading part. Anyone can blog and post charts. Very few succeed in the trading. What’s left is the choice of stock or option, if option what strategy? A bull call spread, or other? Risk management in terms of how much of your capital you wish to risk on this trade. How it correlates to your other positions and overall portfolio. Your expectations of the trade and your exit strategy. Are you using stop losses? Trailing or percent? And on and on…
That part is left for you to decide.
I am long of MNST calls week of October 26th at the 56.5 strike.
Clear as mud?
OC